

Gene co-regulation is highly conserved in the evolution of eukaryotes and prokaryotes
- PMID: 15353560
- PMCID: PMC519111
- DOI: 10.1093/nar/gkh815
Gene co-regulation is highly conserved in the evolution of eukaryotes and prokaryotes
Abstract
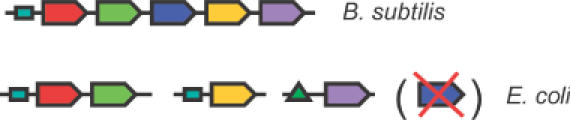
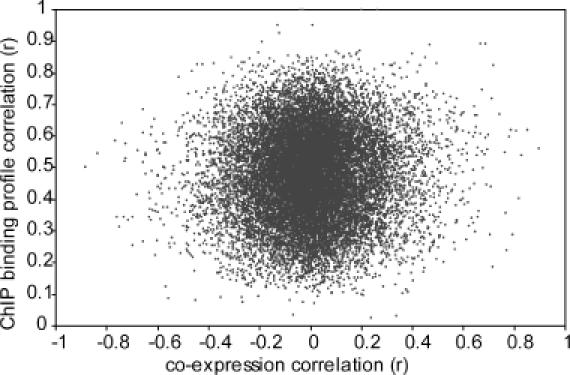
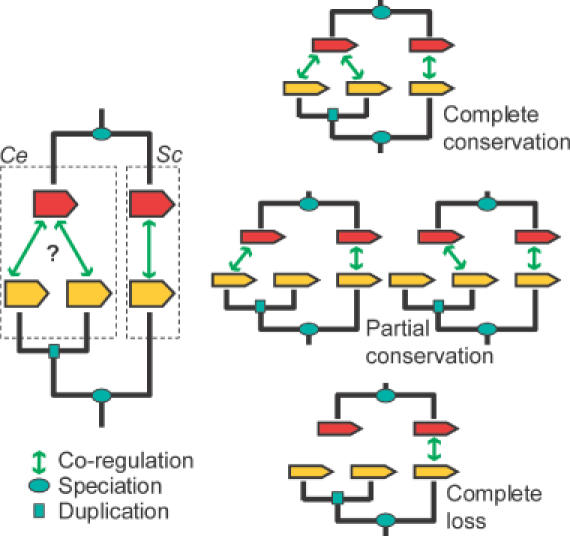
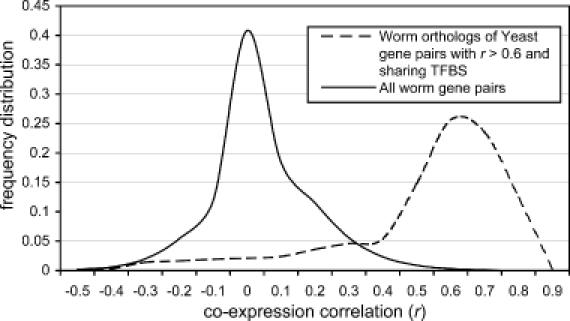
Differences between species have been suggested to largely reside in the network of connections among the genes. Nevertheless, the rate at which these connections evolve has not been properly quantified. Here, we measure the extent to which co-regulation between pairs of genes is conserved over large phylogenetic distances; between two eukaryotes Caenorhabditis elegans and Saccharomyces cerevisiae, and between two prokaryotes Escherichia coli and Bacillus subtilis. We first construct a reliable set of co-regulated genes by combining various functional genomics data from yeast, and subsequently determine conservation of co-regulation in worm from the distribution of co-expression values. For B.subtilis and E.coli, we use known operons and regulons. We find that between 76 and 80% of the co-regulatory connections are conserved between orthologous pairs of genes, which is very high compared with previous estimates and expectations regarding network evolution. We show that in the case of gene duplication after speciation, one of the two inparalogous genes tends to retain its original co-regulatory relationship, while the other loses this link and is presumably free for differentiation or sub-functionalization. The high level of co-regulation conservation implies that reliably predicted functional relationships from functional genomics data in one species can be transferred with high accuracy to another species when that species also harbours the associated genes.
Figures
Similar articles
-
Conservation of gene co-regulation between two prokaryotes: Bacillus subtilis and Escherichia coli.Genome Inform. 2005;16(1):116-24. Genome Inform. 2005. PMID: 16362913
-
Conservation of gene co-regulation in prokaryotes and eukaryotes.Trends Biotechnol. 2002 Oct;20(10):407-10; discussion 410. doi: 10.1016/s0167-7799(02)02032-2. Trends Biotechnol. 2002. PMID: 12220896
-
Predicting regulons and their cis-regulatory motifs by comparative genomics.Nucleic Acids Res. 2000 Nov 15;28(22):4523-30. doi: 10.1093/nar/28.22.4523. Nucleic Acids Res. 2000. PMID: 11071941 Free PMC article.
-
Predicting gene function by conserved co-expression.Trends Genet. 2003 May;19(5):238-42. doi: 10.1016/S0168-9525(03)00056-8. Trends Genet. 2003. PMID: 12711213 Review.
-
Cytokinesis in prokaryotes and eukaryotes: common principles and different solutions.Microbiol Mol Biol Rev. 2001 Jun;65(2):319-33 ; third page, table of contents. doi: 10.1128/MMBR.65.2.319-333.2001. Microbiol Mol Biol Rev. 2001. PMID: 11381104 Free PMC article. Review.
Cited by
-
Computational Network Inference for Bacterial Interactomics.mSystems. 2022 Apr 26;7(2):e0145621. doi: 10.1128/msystems.01456-21. Epub 2022 Mar 30. mSystems. 2022. PMID: 35353009 Free PMC article. Review.
-
A map of human protein interactions derived from co-expression of human mRNAs and their orthologs.Mol Syst Biol. 2008;4:180. doi: 10.1038/msb.2008.19. Epub 2008 Apr 15. Mol Syst Biol. 2008. PMID: 18414481 Free PMC article.
-
Comparative genomic reconstruction of transcriptional regulatory networks in bacteria.Chem Rev. 2007 Aug;107(8):3467-97. doi: 10.1021/cr068309+. Epub 2007 Jul 18. Chem Rev. 2007. PMID: 17636889 Free PMC article. Review. No abstract available.
-
Functional organization of the transcriptome in human brain.Nat Neurosci. 2008 Nov;11(11):1271-82. doi: 10.1038/nn.2207. Epub 2008 Oct 12. Nat Neurosci. 2008. PMID: 18849986 Free PMC article.
-
Characterization of relationships between transcriptional units and operon structures in Bacillus subtilis and Escherichia coli.BMC Genomics. 2007 Feb 13;8:48. doi: 10.1186/1471-2164-8-48. BMC Genomics. 2007. PMID: 17298663 Free PMC article.
References
-
- Copley R.R., Schultz,J., Ponting,C.P. and Bork,P. (1999) Protein families in multicellular organisms. Curr. Opin. Struct. Biol., 9, 408–415. - PubMed
-
- Brett D., Pospisil,H., Valcarcel,J., Reich,J. and Bork,P. (2002) Alternative splicing and genome complexity. Nature Genet., 30, 29–30. - PubMed
-
- Levine M. and Tjian,R. (2003) Transcription regulation and animal diversity. Nature, 424, 147–151. - PubMed
-
- Teichmann S.A. and Babu,M.M. (2002) Conservation of gene co-regulation in prokaryotes and eukaryotes. Trends Biotechnol., 20, 407–410; discussion 410. - PubMed
Publication types
MeSH terms
LinkOut - more resources
Full Text Sources
Other Literature Sources
Molecular Biology Databases
