Review
. 2004 Sep;68(3):560-602, table of contents.
doi: 10.1128/MMBR.68.3.560-602.2004.

Phages and the evolution of bacterial pathogens: from genomic rearrangements to lysogenic conversion

Affiliations
Review

Phages and the evolution of bacterial pathogens: from genomic rearrangements to lysogenic conversion

Harald Brüssow et al. Microbiol Mol Biol Rev. 2004 Sep.

Abstract

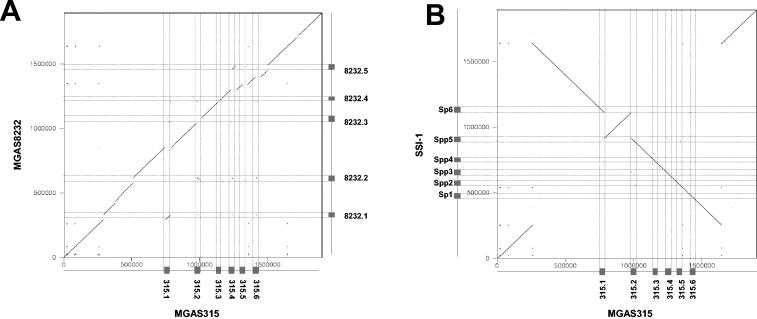
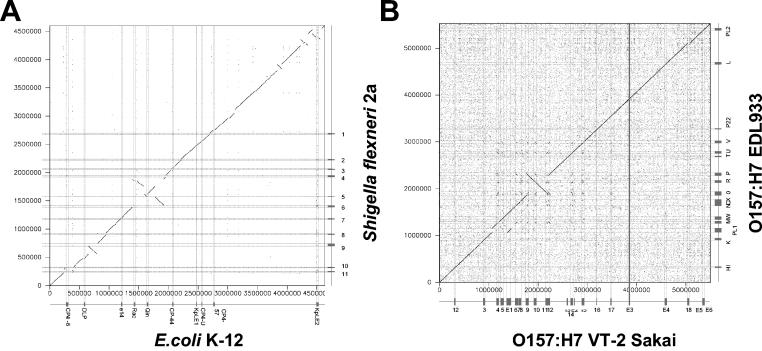
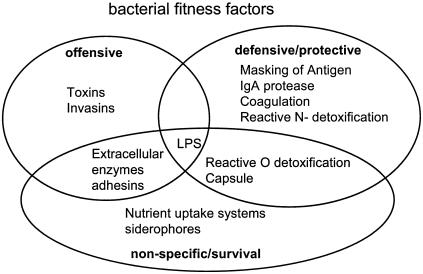
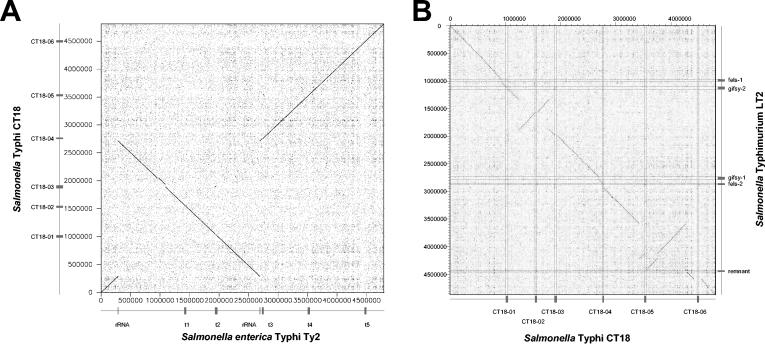
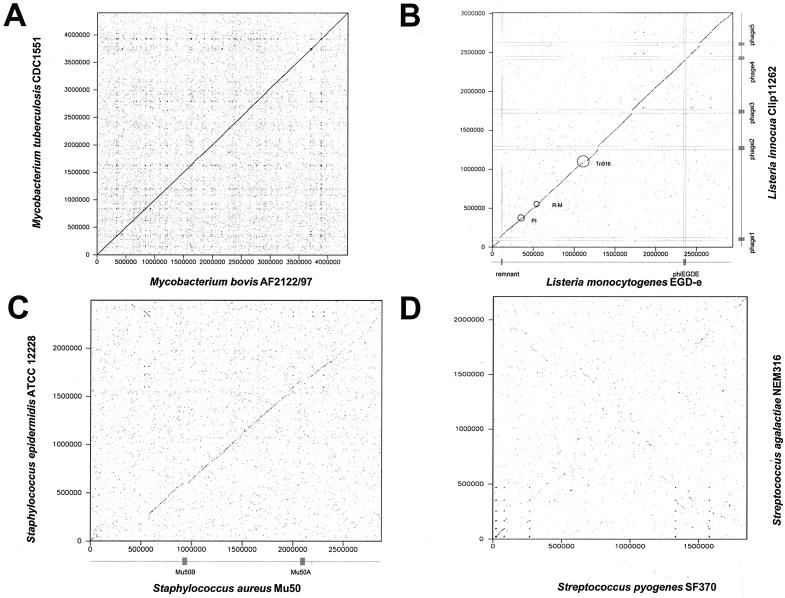
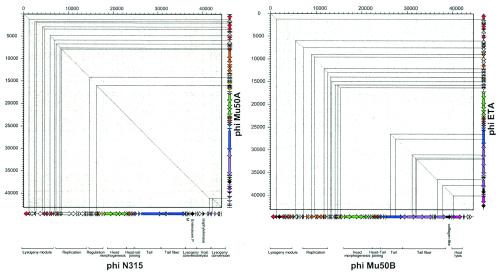
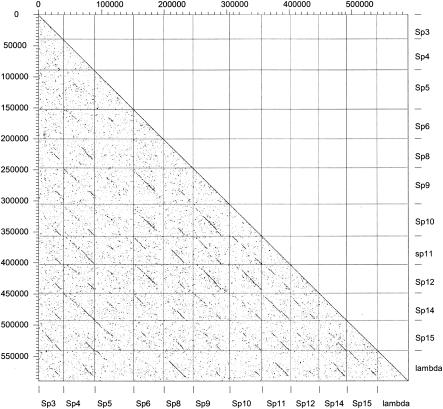
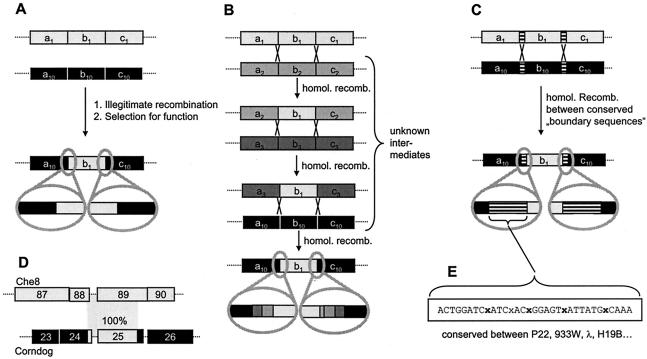
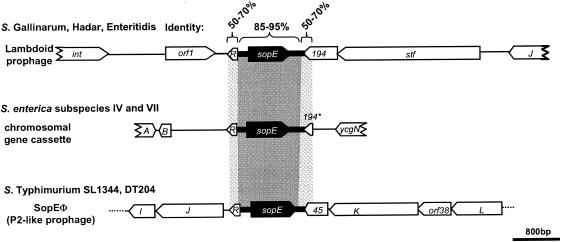
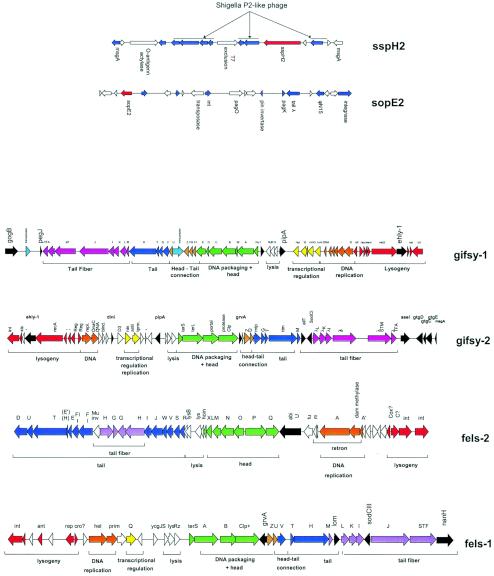
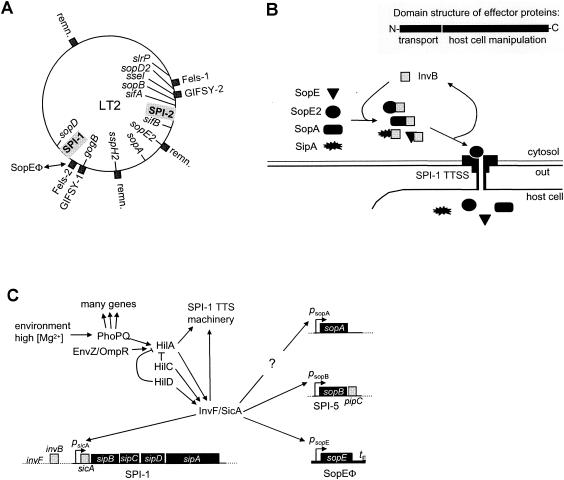
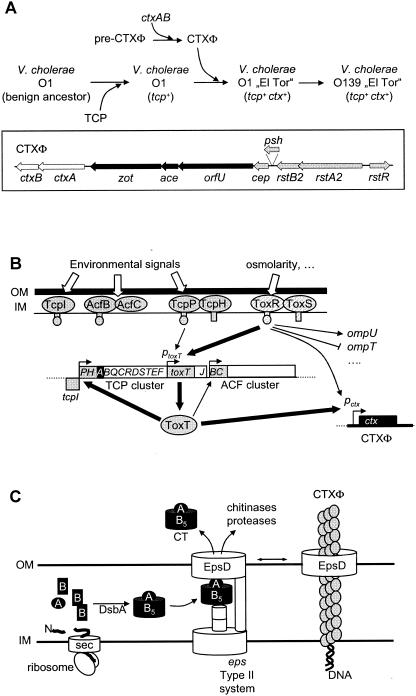
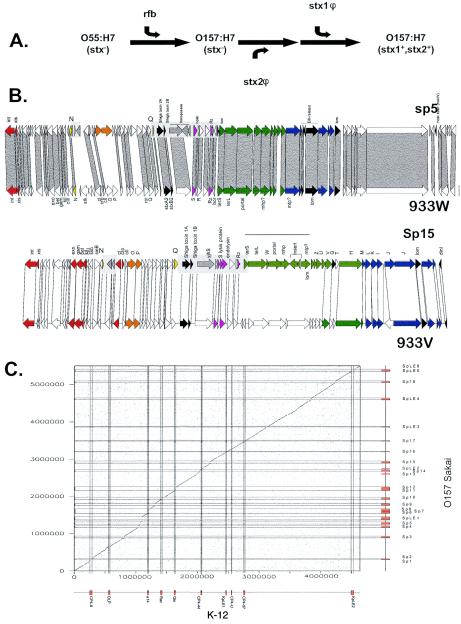
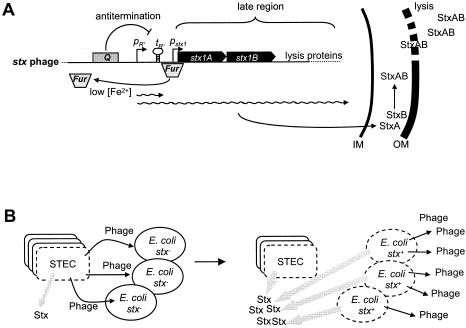
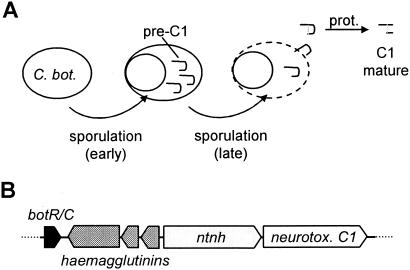
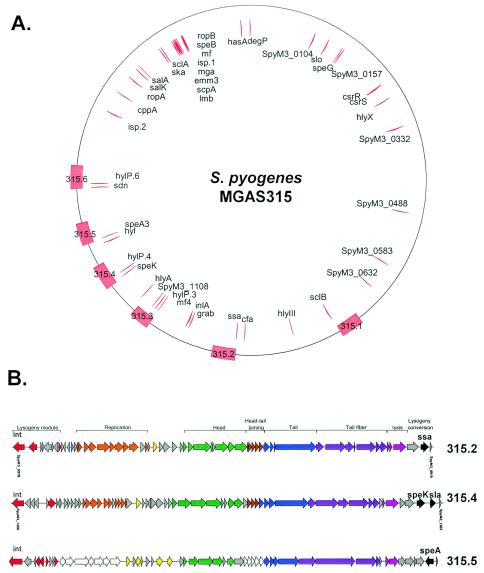
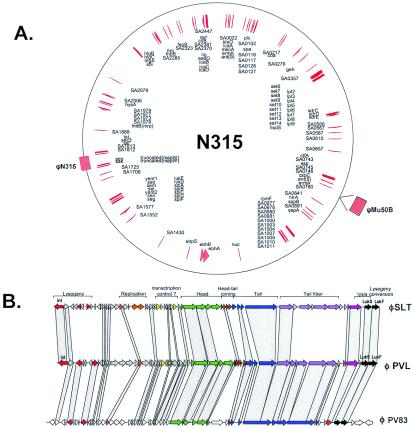
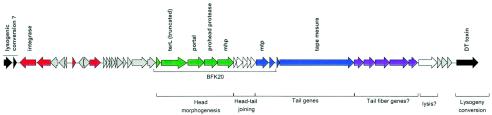
Comparative genomics demonstrated that the chromosomes from bacteria and their viruses (bacteriophages) are coevolving. This process is most evident for bacterial pathogens where the majority contain prophages or phage remnants integrated into the bacterial DNA. Many prophages from bacterial pathogens encode virulence factors. Two situations can be distinguished: Vibrio cholerae, Shiga toxin-producing Escherichia coli, Corynebacterium diphtheriae, and Clostridium botulinum depend on a specific prophage-encoded toxin for causing a specific disease, whereas Staphylococcus aureus, Streptococcus pyogenes, and Salmonella enterica serovar Typhimurium harbor a multitude of prophages and each phage-encoded virulence or fitness factor makes an incremental contribution to the fitness of the lysogen. These prophages behave like "swarms" of related prophages. Prophage diversification seems to be fueled by the frequent transfer of phage material by recombination with superinfecting phages, resident prophages, or occasional acquisition of other mobile DNA elements or bacterial chromosomal genes. Prophages also contribute to the diversification of the bacterial genome architecture. In many cases, they actually represent a large fraction of the strain-specific DNA sequences. In addition, they can serve as anchoring points for genome inversions. The current review presents the available genomics and biological data on prophages from bacterial pathogens in an evolutionary framework.


Figures

FIG. 1.
FIG. 1.
Genome comparisons of S. pyogenes strains. A dot plot alignment of the genomes from a U.S. M3 S. pyogenes strain MGAS315 (horizontal) against a U.S. M18 S. pyogenes strain MGAS8232 (vertical axis) (A) or a Japanese M3 S. pyogenes strain SSI-1 (vertical axis) (B) is shown. The position and name of the prophages are indicated by boxes on the axes and by thin horizontal and vertical lines crossing the dot plot. The dot plot was done with the Dottup program (http://www.emboss.org/); the word size was 15, the output format was Postscript, the program was run in the direct and reverse directions, and the figures were combined. The numbers and ticks on the axes give the scale for the genomes in base pairs.
FIG. 2.
FIG. 2.
Genome comparisons of E. coli strains. (A) Dot plot alignment of the laboratory E. coli strain K-12 (horizontal axis) against the S. flexneri strain 2a (vertical axis). Shigella is treated here as a subspecies of E. coli. (B) Dot plot alignments of a Japanese (horizontal axis) against a U.S. (vertical axis) Shiga-toxin producing O157:H7 E. coli strain. The prophages and prophage-like elements are indicated on the axes by boxes and by thin horizontal and vertical lines crossing the dot plot.
FIG. 3.
FIG. 3.
Fitness factors commonly found in pathogenic bacteria. LPS, lipopolysaccharide.
FIG. 4.
FIG. 4.
Genome comparisons of S. enterica strains. (A) Dot plot alignment of the S. enterica serovar Typhi strain Ty2 (horizontal axis) versus serovar Typhi strain CT18 (vertical axis). The positions of prophages and prophage remnants are indicated by boxes. The two rRNA gene clusters which served as anchoring points for genome rearrangement are marked with a tick. (B) Dot plot alignment of the S. enterica serovar Typhi strain CT18 (horizontal axis) versus S. enterica serovar Typhimurium strain LT2 (vertical axis). The locations and names of the prophages are given.
FIG. 5.
FIG. 5.
Genome comparisons of gram-positive bacteria belonging to different species. The four panels compare two species from the high-G+C-content gram-positive bacterial genus Mycobacterium (M. tuberculosis versus M. bovis [A]) and two species from three different genera of low-G+C-content gram-positive bacteria, namely, Listeria (L. innocua versus L. monocytogenes [B]), Staphylococcus (S. aureus versus S. epidermidis [C]), and Streptococcus (S. pyogenes versus S. agalactiae [D]). In panels B and C, the positions of the prophages are indicated by boxes at the axes and thin lines crossing the dot plot. Further mobile elements are circled (transposon Tn916, restriction-modification genes R-M, and pathogenicity island PI).
FIG. 6.
FIG. 6.
Genome comparison of S. aureus prophages. (A) Dot plot alignment of prophages φN315 (horizontal axis) versus prophage φMu50A (vertical axis) extracted from two closely related S. aureus strains. The prophage maps were projected at the axes to facilitate the orientation. The modular structure of the prophages is indicated by a color code, and the putative function of the modules is indicated for prophage φN315. Candidate virulence factors are marked in black. The thin lines locate the gaps in the alignment on the prophage maps. (B) Dot plot alignment of distantly related S. aureus prophages φMu50B (horizontal axis) versus φETA (vertical axis). The prophage genome maps and their color-coded modular organization are shown on the axes. The thin lines locate the regions of DNA sequence identity on the prophage genome maps.
FIG. 7.
FIG. 7.
Dot plot matrix for the lambda-like prophages from E. coli strain O157:H7 VT-2 Sakai. The genomes of the lambda-like prophage from the Sakai strain were plotted versus themselves and phage lambda. At the bottom and on the right axis, the prophage names are given as in the original publication. Some prophage genomes were inverted to correct for the distinct orientation of the prophage genomes located on the right and left sides of the terminus of replication.
FIG. 8.
FIG. 8.
Molecular models for module exchange between phages. (A) Module exchange by illegitimate recombination. (B) Module exchange by repeated homologous recombination. This results in blocks of lower sequence identity at the border between modules. The more recombinations occur, the less easily these blocks can be recognized. (C) Module exchange by recombination via conserved linker sequences. (D) Identical (100% identity) sequence elements in different regions of two unrelated phages (177). (E) Example of a conserved linker sequence in a lambdoid phage.
FIG. 9.
FIG. 9.
Localization of the sopE moron in different Salmonella spp. Reprinted from reference with permission.
FIG. 10.
FIG. 10.
Prophages and phage remnants in the S. enterica serovar Typhimurium strain LT2. (Top) Prophage remnants encoding the type III effector proteins SspH2 and SopE2. Phage-like genes in the vicinity of sspH2 and sopE2 are highlighted in blue. Selected genes are annotated. (Bottom) Genome maps of the four LT2 prophages. The modular structure of the prophages is indicated by the color code and the annotated brackets under the prophage genome maps. Proven or suspected fitness and virulence genes are colored in black.
FIG. 11.
FIG. 11.
sopE moron of S. enterica serovar Typhimurium. (A) Chromosomal map of S. enterica serovar Typhimurium LT2. The chromosomal locations of the SPI-1 and SPI-2 TTSS, the type III effector proteins (inside the circle), and of the prophages and phage remnants (remn.) (outside the circle) are shown. (B) Role of the chaperone InvB in the transport of the type III effector proteins SopE, SopE2, SopA, and SipA. (Inset) General domain structure of type III effector proteins. N terminus, chaperone interaction and transport via the TTSS; rest of the effector protein, domains for manipulation of signaling cascades in eukaryotic cells. (C) Outline of the regulation of SPI-1 TTSS effector protein expression in S. enterica serovar Typhimurium.
FIG. 12.
FIG. 12.
CT moron. (A) Model for the evolution of toxigenic V. cholerae strains. (B) Regulation of ctx expression. (C) Assembly and secretion of CT and CTXΦ.
FIG.13.
FIG.13.
Analysis of the sequenced E. coli O157:H7 strains. (A) Likely sequence of events that transformed E. coli O55:H7 into E. coli O157:H7. The sequential acquisition of O-antigen modifying genes and two prophages is indicated along the arrows representing the time line. (B) Comparative prophage maps of the Stx2-encoding prophages sp5 (Sakai) and 933W (EDL933) (top) and of the Stx1-encoding prophages sp15 (Sakai) and 933V (EDL933) (bottom). Selected genes are annotated above and below the gene map with their putative function. (C) Dot plot alignment of E. coli strains K-12 and O157 Sakai. The positions of the prophage and prophage-like elements are indicated by red boxes at the axes, and they are located by thin lines.
FIG. 14.
FIG. 14.
Expression of Shiga toxin by STEC and amplification by recruitment of bystander bacteria. (A) Model for the regulation of stx expression in phage H19B. pR′ is the promoter for the stxAB late-gene operon. Normally, transcription is terminated by tR′. The antiterminator Q allows the transcription to override tR′ and expression of the entire operon. A second Fur-regulated promoter might exist. The A and B subunits carry secretion signals and are assembled to form the mature AB toxin in the periplasm. Release from the periplasm occurs on cell lysis. IM, inner membrane; OM, outer membrane. (B) STEC converts nontoxigenic E. coli strains present in the gut flora. This leads to amplification of toxin and phage release and ensures that most STEC bacteria survive.
FIG. 15.
FIG. 15.
C1 phage of C. botulinum. (A) Neurotoxin release during sporulation. (B) Organization of the neurotoxin (neurotox.) C1 locus.
FIG. 16.
FIG. 16.
S. pyogenes strain MGAS315 and its prophage- and chromosome-encoded virulence factors. (A) Genome map of the M3 S. pyogenes strain. The positions of the prophages are indicated on the outer circle by red boxes and their names. Proven and suspected virulence factors are located as red arrows on the inner circle and marked with their gene annotation. The origin of replication is located at the top. (B) Genome maps of three prophages. The modular structure of the prophage genome and the function of the modules are indicated. The virulence genes are marked in black (for details, see Table 3).
FIG. 17.
FIG. 17.
S. aureus strain N315 and its prophage- and chromosome-encoded virulence factors. (A) Genome map of the N315 strain. The positions of the φN315 prophage and of the φMu50B prophage present in a closely related S. aureus strain are indicated. A selection of proven and suspected virulence factors are indicated by red arrows on the inner circle (for details, see Table 4). The origin of replication is located at the top. (B) Genome maps of three prophages from different S. aureus strains. The modular structure of the prophage genome is indicated. The virulence genes are indicated by black arrows.
FIG. 18.
FIG. 18.
Prophage genome map of the C. diphtheriae prophage encoding DT. The map indicates the modular structure of the corynephage by a color code and the annotated brackets. The BFK20 bracket marks a region of high similarity to a Brevibacterium phage. Selected genes are annotated.

Similar articles

Cited by

References

    1. Acheson, D. W., J. Reidl, X. Zhang, G. T. Keusch, J. J. Mekalanos, and M. K. Waldor. 1998. In vivo transduction with shiga toxin 1-encoding phage. Infect. Immun. 66:4496-4498. - PMC - PubMed
    1. Affolter, M., C. Parent-Vaugeois, and A. Anderson. 1983. Curing and induction of the Fels 1 and Fels 2 prophages in the Ames mutagen tester strains of Salmonella typhimurium. Mutat. Res. 110:243-262. - PubMed
    1. Allison, G. E., D. Angeles, N. Tran-Dinh, and N. K. Verma. 2002. Complete genomic sequence of SfV, a serotype-converting temperate bacteriophage of Shigella flexneri. J. Bacteriol. 184:1974-1987. - PMC - PubMed
    1. Allison, G. E., D. C. Angeles, P. Huan, and N. K. Verma. 2003. Morphology of temperate bacteriophage SfV and characterisation of the DNA packaging and capsid genes: the structural genes evolved from two different phage families. Virology 308:114-127. - PubMed
    1. Al Mamun, A. A., A. Tominaga, and M. Enomoto. 1997. Cloning and characterization of the region III flagellar operons of the four Shigella subgroups: genetic defects that cause loss of flagella of Shigella boydii and Shigella sonnei. J. Bacteriol. 179:4493-4500. - PMC - PubMed

Publication types

LinkOut - more resources