. 2004 Sep 21;101(38):13891-6.
doi: 10.1073/pnas.0405340101. Epub 2004 Sep 7.

Molecular basis for catecholaminergic neuron diversity

Affiliations

Molecular basis for catecholaminergic neuron diversity

Jan Grimm et al. Proc Natl Acad Sci U S A. .

Abstract

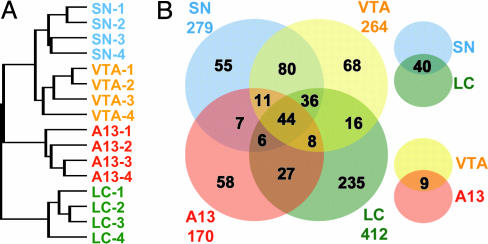
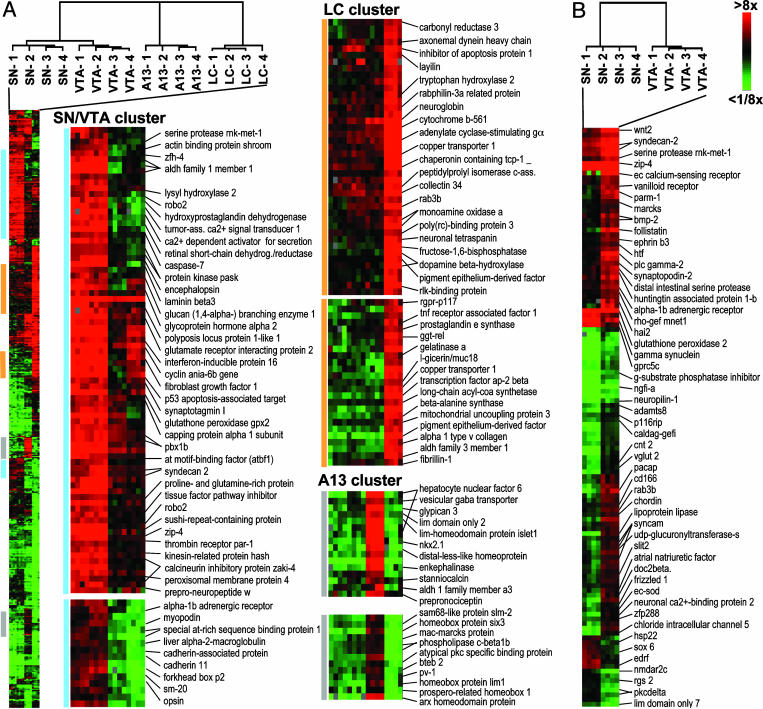
Catecholaminergic neurons control diverse cognitive, motor, and endocrine functions and are associated with multiple psychiatric and neurodegenerative disorders. We present global gene-expression profiles that define the four major classes of dopaminergic (DA) and noradrenergic neurons in the brain. Hypothalamic DA neurons and noradrenergic neurons in the locus coeruleus display distinct group-specific signatures of transporters, channels, transcription, plasticity, axon-guidance, and survival factors. In contrast, the transcriptomes of midbrain DA neurons of the substantia nigra and the ventral tegmental area are closely related with <1% of differentially expressed genes. Transcripts implicated in neural plasticity and survival are enriched in ventral tegmental area neurons, consistent with their role in schizophrenia and addiction and their decreased vulnerability in Parkinson's disease. The molecular profiles presented provide a basis for understanding the common and population-specific properties of catecholaminergic neurons and will facilitate the development of selective drugs.


Figures

Fig. 1.
Fig. 1.
Isolation of intact RNA from CA neurons. (A) Identification of CA neurons in the SN, VTA, zona incerta, and LC in coronal brain sections of the rat by rapid TH immunostaining. (B) Laser microdissection of individual neurons in the SN. (C) Preserved integrity of RNA in immunostained brain sections. Scale bar indicates 250 μm(A Upper and Lower Right), 75 μm(A Lower Left), and 15 μm(B).
Fig. 2.
Fig. 2.
Expression of CA biosynthetic enzymes and transporters in DA and NA cell groups. The ratios of expression in the respective cell group compared with the whole-brain reference are shown. Error bars indicate 95% confidence interval. AADC, aromatic amino acid decarboxylase; DHPR, dihydropteridine reductase; GTPCH I, GTP cyclohydrolase I; PCD, pterin-4-α-carbinolamine dehydratase; VMAT-2, vesicular monoamine transporter 2.
Fig. 3.
Fig. 3.
Relationship among classes of CA neurons. (A) Dendrogram showing the relationship of the gene-expression profiles of all experiments. The tree was generated by unsupervised hierarchical clustering based on all features that were significant (P < 0.01) and >2.6 SDs over background in >80% of all experiments (13,173 of 14,797 genes). (B) Venn diagram showing shared and distinct expression of genes enriched in CA neurons. Genes with >4-fold expression compared with the whole-brain reference were selected for each group of neurons, with a false-discovery rate of <1%.
Fig. 4.
Fig. 4.
Supervised cluster analysis of genes with differential expression between CA cell groups. (A) Genes were filtered based on their expression level relative to the whole-brain reference (>4-fold higher or lower in at least 3 of 16 experiments), and transcripts with significant differences in expression between at least two cell groups were selected by multiclass sam, with a false-discovery rate of <1%. The resulting set of 534 genes and the experimental samples were grouped based on their similarities of gene expression by two-dimensional hierarchical clustering (Pearson correlation, average linkage). Selected gene clusters with preferential expression in SN/VTA, LC, or A13 cell groups are shown, and known annotated genes are listed. The complete list of genes is provided in Table 2, which is published as supporting information on the PNAS web site. (B) Differential gene expression between SN and VTA neurons. Genes with significant differences in expression were identified by sam (false-discovery rate of <1%) and sorted by hierarchical clustering. Selected genes are annotated. The complete list of genes is provided in Table 3, which is published as supporting information on the PNAS web site.
Fig. 5.
Fig. 5.
Validation of the gene-expression profiles by in situ hybridization. As predicted by microarray analysis, MHC class I heavy chain and the hypothetical protein LOC313453 were detected in all four cell groups, whereas expression of HNF-6 was restricted to the hypothalamus, and Ctr1 and the hypothetical protein LOC290558 were restricted to the LC. ZIP4 expression was strong in SN and VTA, whereas γ-synuclein transcripts were abundant in the SN and LC but low in the VTA and A13 cell groups. The PARM-1 message was abundant in the VTA and A13 cell groups, with lower levels in the SN and LC. Expression of PARM-1 was not confined to CA cell groups, as expected from the low ratios of expression measured by microarray.

Similar articles

Cited by

References

    1. Dahlstroem, A. & Fuxe, K. (1964) Acta Physiol. Scand. Suppl. 232, 1–55. - PubMed
    1. Björklund, A. & Lindvall, O. (1984) in Handbook of Chemical Neuroanatomy, eds. Björklund, A. & Hökfelt, T. (Elsevier, New York), Vol. 2, Part 1, pp. 55–122.
    1. Hirsch, E., Graybiel, A. M. & Agid, Y. A. (1988) Nature 334, 345–348. - PubMed
    1. Uhl, G. R., Hedreen, J. C. & Price, D. L. (1985) Neurology 35, 1215–1218. - PubMed
    1. Purba, J. S., Hofman, M. A. & Swaab, D. F. (1994) Neurology 44, 84–89. - PubMed