. 2004 Nov;94(5):675-89.
doi: 10.1093/aob/mch193. Epub 2004 Sep 8.

Sugar-responsive gene expression, invertase activity, and senescence in aborting maize ovaries at low water potentials

Affiliations

Sugar-responsive gene expression, invertase activity, and senescence in aborting maize ovaries at low water potentials

John E McLaughlin et al. Ann Bot. 2004 Nov.

Abstract

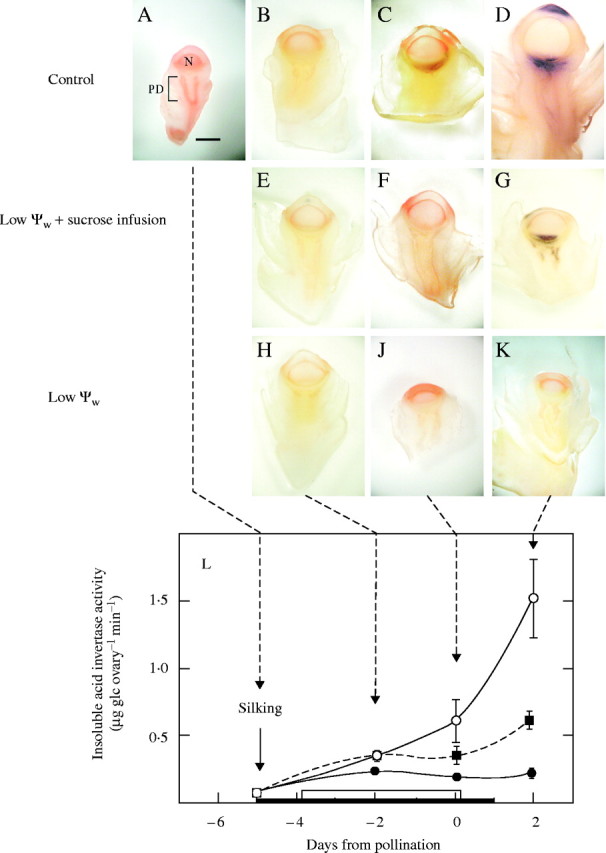
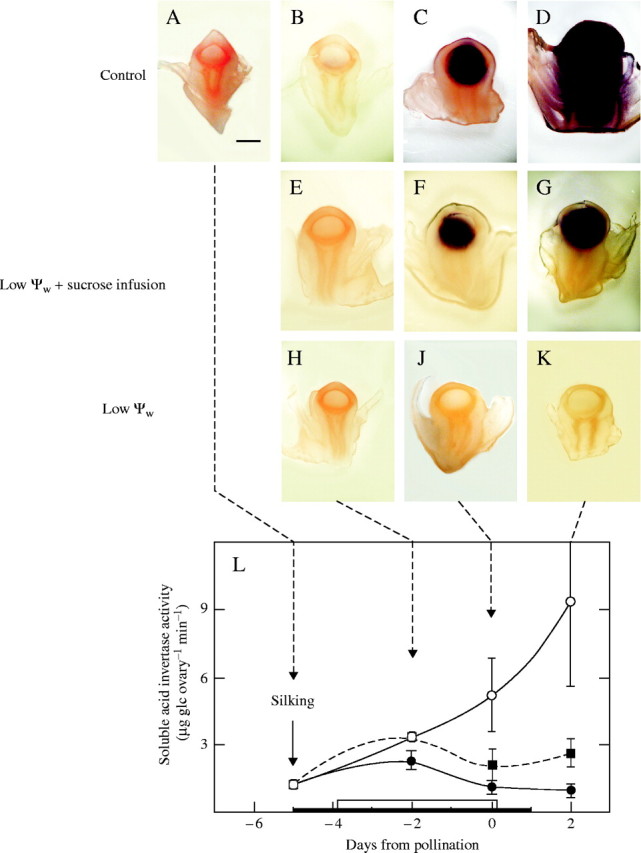
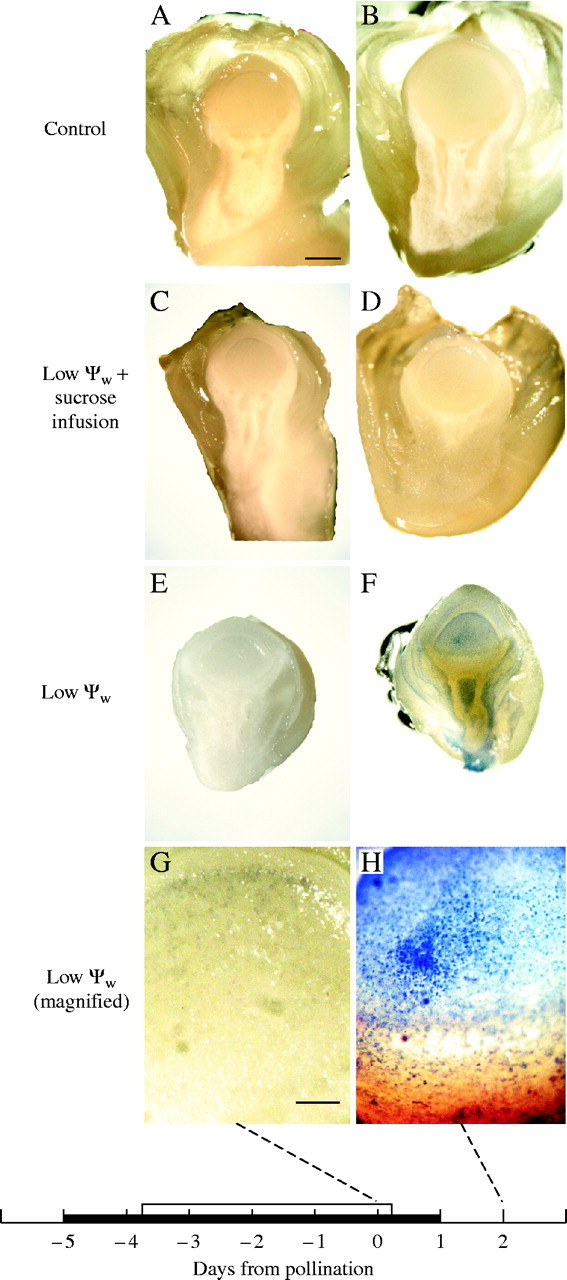
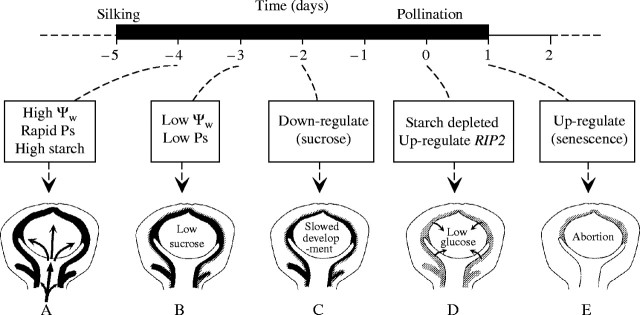
Background and aims: Ovary abortion can occur in maize (Zea mays) if water deficits lower the water potential (psiw) sufficiently to inhibit photosynthesis around the time of pollination. The abortion decreases kernel number. The present work explored the activity of ovary acid invertases and their genes, together with other genes for sucrose-processing enzymes, when this kind of abortion occurred. Cytological evidence suggested that senescence may have been initiated after 2 or 3 d of low psiw, and the expression of some likely senescence genes was also determined.

Methods: Ovary abortion was assessed at kernel maturity. Acid invertase activities were localized in vivo and in situ. Time courses for mRNA abundance were measured with real time PCR. Sucrose was fed to the stems to vary the sugar flux.

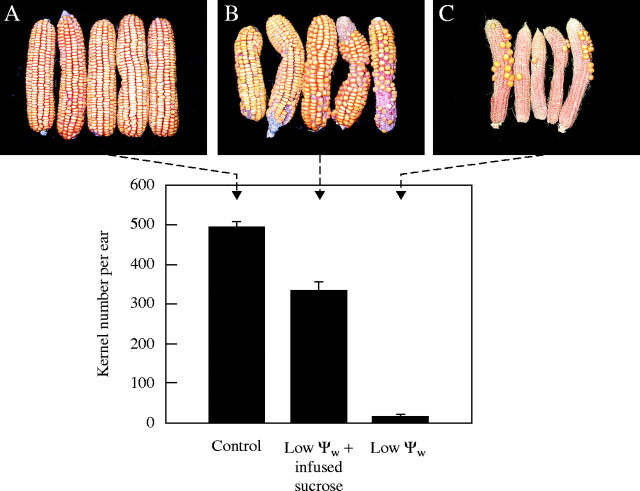
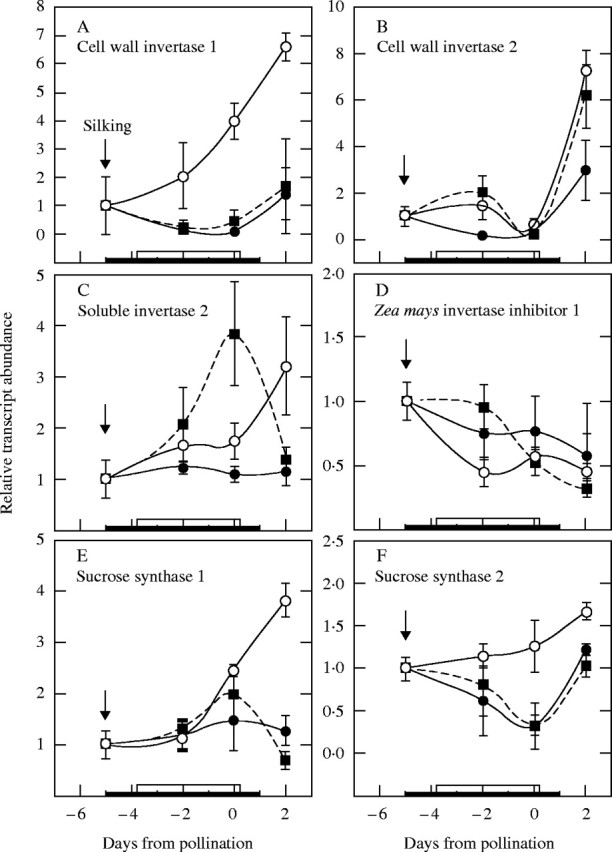
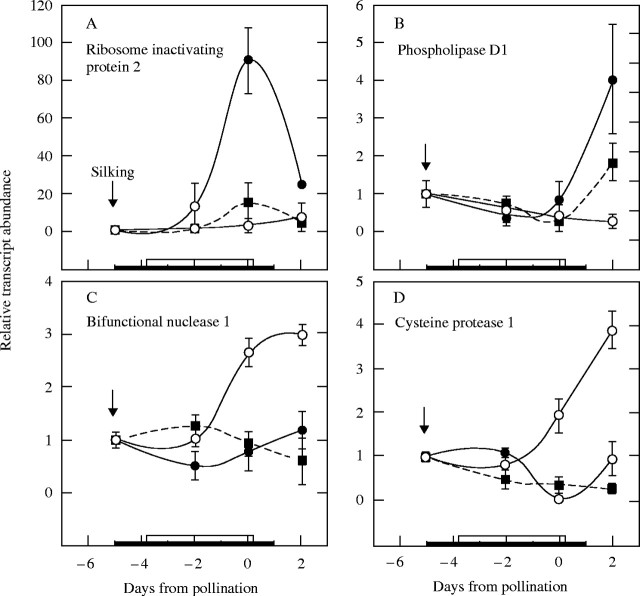
Key results: Many kernels developed in controls but most aborted when psiw became low. Ovary invertase was active in controls but severely inhibited at low psiw for cell wall-bound forms in vivo and soluble forms in situ. All ovary genes for sucrose processing enzymes were rapidly down-regulated at low psiw except for a gene for invertase inhibitor peptide that appeared to be constitutively expressed. Some ovary genes for senescence were subsequently up-regulated (RIP2 and PLD1). In some genes, these regulatory changes were reversed by feeding sucrose to the stems. Abortion was partially prevented by feeding sucrose.

Conclusions: A general response to low psiw in maize ovaries was an early down-regulation of genes for sucrose processing enzymes followed by up-regulation of some genes involved in senescence. Because some of these genes were sucrose responsive, the partial prevention of abortion with sucrose feeding may have been caused in part by the differential sugar-responsiveness of these genes. The late up-regulation of senescence genes may have caused the irreversibility of abortion.


Figures

F<sc>ig</sc>. 1.
Fig. 1.
Ear development and kernel numbers at maturity in maize subjected to low ψw around the time of pollination. (A) Controls at high ψw, (B) low ψw plus sucrose infused into stems, (C) low ψw. Ears are somewhat crooked because ovaries were sampled in mid-ear around the time of pollination, which caused slight deformation at maturity. Sampled areas are on back of ear and not visible. Histogram indicates means ± s.e. for 9–11 plants assuming development in sampled areas was similar to that in unsampled areas.
F<sc>ig</sc>. 2.
Fig. 2.
Cell wall-bound acid invertase activity in vivo in maize ovaries when low ψw occurred around the time of pollination for the ears in Fig. 1. Invertase shown as dark areas. (A–D) Control: high ψw. Activity increased from (A) to (D) and was located in upper pedicel (PD) tissue below nucellus (N). Ovaries became substantially larger at later times. (E–G) Low ψw + sucrose infusion: images show less activity than in controls, barely visible in (F) and apparent in (G). Activity in (G) was visible in two out of every three samples. (H–K) Low ψw: no activity was detected. No enlargement of ovaries. Scale bar = 1 mm. (L) For comparison with images, in vitro assays are shown for cell wall-bound acid invertase from Zinselmeier et al. (1999). Conditions for (L) were identical to those for (A–K) except for maize genotype. Black bar on abscissa indicates water was withheld on day −5 and resupplied on day 1. White bar on abscissa indicates sucrose was infused into stem each day beginning on day −4 and continuing through day 0.
F<sc>ig</sc>. 3.
Fig. 3.
Same as Fig. 2 but for soluble acid invertase in situ. (A–D) Control: high ψw. Soluble activity was associated with nucellus and increased markedly at later times. Because of high activity at (D), there was over-development and non-specific staining in this image. (E–G) Low ψw + sucrose infusion: activity was less than in controls and more variable. Activity in (F) and (G) was apparent in two out of three samples. (H–K) Low ψw: activity was undetectable. Scale bar = 1 mm. (L) For comparison with images, in vitro assays are shown for soluble acid invertase from Zinselmeier et al. (1999). Note higher activity in (L) than for cell wall-bound invertase in Fig. 2L.
F<sc>ig</sc>. 4.
Fig. 4.
Typical analysis of mRNA abundance using real-time PCR. (A) Progress of PCR amplification expressed as log ΔRn in various PCR cycles using SYBR Green and gene-specific primer for maize ovary Incw2 on day 2 of Fig. 2. Three replicate extracts were made from ovaries from three treatments: control plants (filled squares), plants at low ψw plus sucrose infusion (filled circles), plants at low ψw (filled triangles). Also shown is a no template control (open circles). The dashed line represents the selected Ct threshold at which mRNA abundance was assessed. Greater cycle number to reach the threshold indicates lower abundance of mRNA. Three replicates are superimposed for each treatment and are often too close to be distinguished in this figure. (B) Thermal denaturation of amplicons produced in (A). Following the final real-time PCR analysis, each sample was subjected to thermal denaturation to test the purity of amplification, judged from the number of peaks in the denaturation response. Each denaturation curve represents one amplicon from (A), and the single symmetrical peak indicates high purity. Denaturation shown as decrease in fluorescence of SYBR Green as temperature increased.
F<sc>ig</sc>. 5.
Fig. 5.
mRNA abundance profile for genes of sucrose processing enzymes in maize ovaries at various times when low ψw occurred around pollination. See Fig. 1 for sampled ears at maturity. Real-time PCR analysis as in Fig. 4 for (A) cell-wall invertase 1 (Incw1), (B) cell-wall invertase 2 (Incw2), (C) soluble invertase 2 (Ivr2), (D) Zea mays invertase inhibitor 1 (Zminh1), (E) sucrose synthase 1 (SS1), and (F) sucrose synthase 2 (SS2). Control at high ψw (open circles), low ψw plus sucrose infusion into the stems (filled squares), low ψw (filled circles). The black bar on the abscissa indicates when water was withheld from the soil. The white bar indicates when sucrose was infused into stems starting on day −4 and continuing each day to include day 0. Data are means ± s.e. for three separate plants relative to mRNA abundance on day −5 before treatments were imposed.
F<sc>ig</sc>. 6.
Fig. 6.
Evans Blue staining of maize ovaries when low ψw occurred around the time of pollination, for ears in Fig. 1. (A and B) Control: high ψw. No stain visible. (C and D) Low ψw plus sucrose infusion. No stain visible. (E and F) Low ψw. No stain detectable in (E) but stain is apparent in (F). Stain in (F) is present in nucellus and around vascular tissue in upper pedicel 2 d after pollination. (G and H) Magnified view of nucellus in (E and F). No stain detected in (G) but present in individual cells in (H). The black bar on the abscissa indicates when water was withheld from the soil. Plants were rewatered on day 0. The white bar indicates when sucrose was infused into stems starting on day −4 and continuing each day to include day 0. Scale bars: A–F = 1 mm; G and H = 0·1 mm.
F<sc>ig</sc>. 7.
Fig. 7.
mRNA abundance for genes coding for enzymes that breakdown ribosomes, phospholipids, nucleic acids, or proteins in maize ovaries at various times when low ψw occurred around pollination. See Fig. 1 for ears sampled at maturity. Real-time PCR analysis as in Fig. 4 for (A) Ribosome inactivating protein 2 (RIP2), (B) phospholipase D (PLD1), (C) bifunctional nuclease 1 (BFN1), (D) cysteine protease 1 (CCP1). Control at high ψw (open circles), low ψw plus sucrose infusion into the stems (filled squares), low ψw (filled circles). The black bar on the abscissa indicates when water was withheld from the soil. The white bar indicates when sucrose was infused into stems starting on day −4 and continuing each day to include day 0. Data are means ± s.e. for three separate plants relative to mRNA abundance on day −5 before treatments were imposed.
F<sc>ig</sc>. 8.
Fig. 8.
Summary of events leading to abortion of maize ovaries when plants are subjected to low ψw around the time of pollination. (A) Photosynthesis providing sucrose to give about 1 mg of dry mass on the day of pollination to ovaries containing 3 mg of dry mass. About 0·4 mg of the dry mass is starch shown as black area in ovary wall. (B) ψw low enough to inhibit photosynthesis curtails sucrose delivery. (C) Genes for sucrose processing are down-regulated. (D) Lack of sucrose triggers starch breakdown, maintaining glucose for a short time. About the time glucose concentrations fall, RIP2 is up-regulated. (E) With a continued lack of glucose, certain senescence genes are up-regulated, leading to irreversible loss in development.

Similar articles

Cited by

References

    1. Allen SM, Helentjaris T, Bate NJ. 2001. Novel invertase inhibitors and methods of use. Pioneer Hi-Bred Inc. (US); E.I. Du Pont De Nemours and Company (US). WO Patent 0158939-A. Date issued: 16 August.
    1. Andersen MN, Asch F, Wu Y, Jensen CR, Naested H, Mogensen VO, Koch KE. 2002. Soluble invertase expression is an early target of drought stress during the critical, abortion-sensitive phase of young ovary development in maize. Plant Physiology 130: 591–604. - PMC - PubMed
    1. Aubert S, Gout E, Bligny R, Marty-Mazars D, Barrieu F, Alabouvette J, Marty F, Douce R. 1996. Ultrastructural and biochemical characterization of autophagy in higher plant cells subjected to carbon deprivation: control by the supply of mitochondria with respiratory substrates. Journal of Cell Biology 133: 1251–1263. - PMC - PubMed
    1. Bass HW, OBrian GR, Boston RS. 1995. Cloning and sequencing a second ribosome-inactivating protein gene from maize (Zea mays L.). Plant Physiology 107: 661–662. - PMC - PubMed
    1. Bate NJ, Niu X, Wang Y, Reimann KS, Helentjaris TG. 2004. An invertase inhibitor from maize localizes to the embryo surrounding region during early kernel development. Plant Physiology 134: 1–9. - PMC - PubMed

Publication types

MeSH terms