. 2004 Sep 8;24(36):7779-88.
doi: 10.1523/JNEUROSCI.1899-04.2004.

Mitochondrial alpha-ketoglutarate dehydrogenase complex generates reactive oxygen species

Affiliations

Mitochondrial alpha-ketoglutarate dehydrogenase complex generates reactive oxygen species

Anatoly A Starkov et al. J Neurosci. .

Abstract

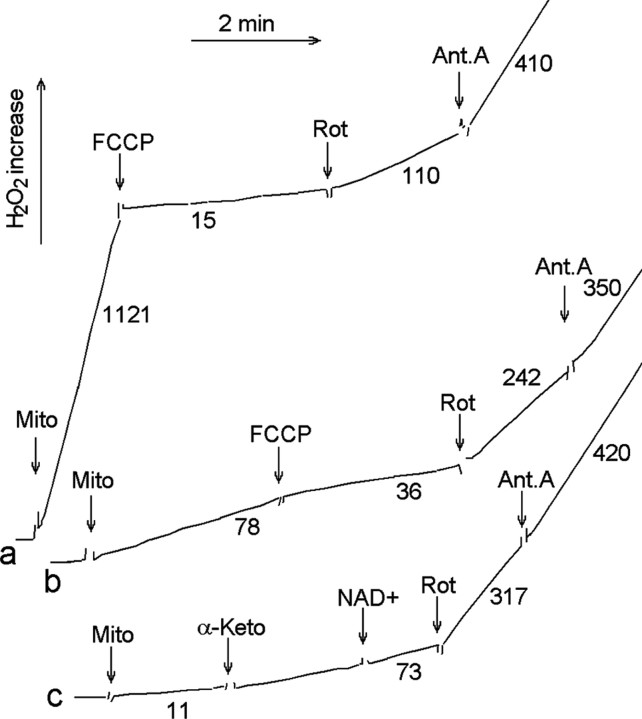
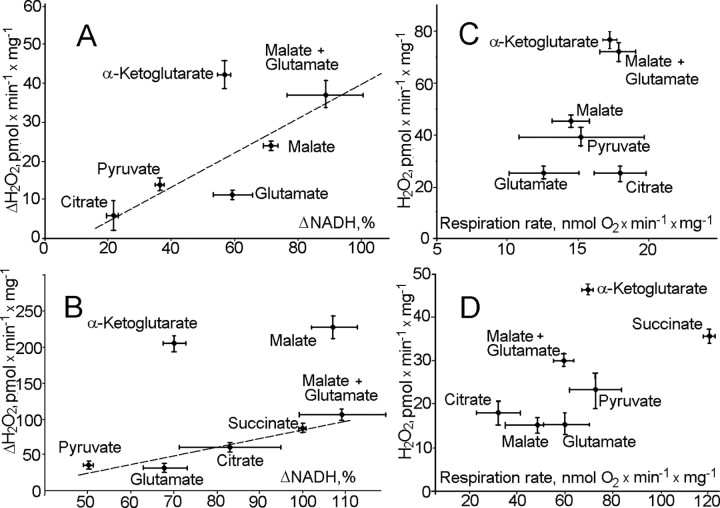
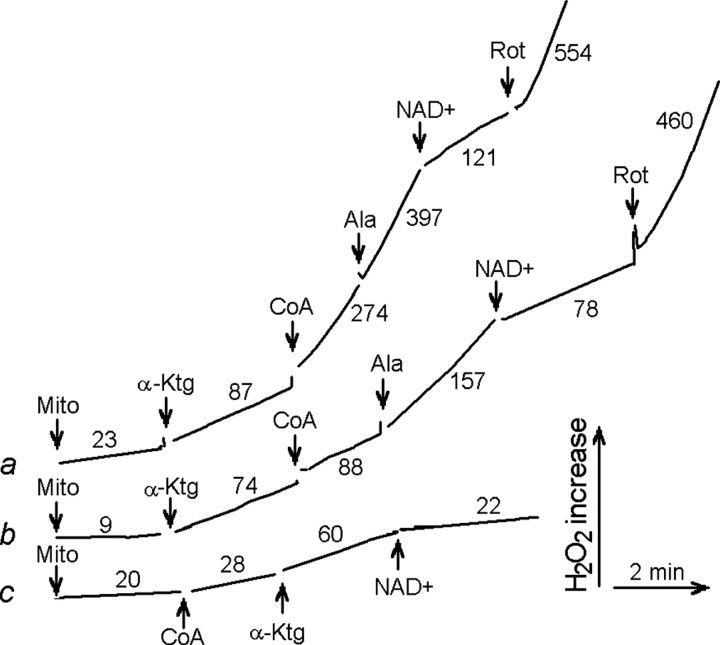
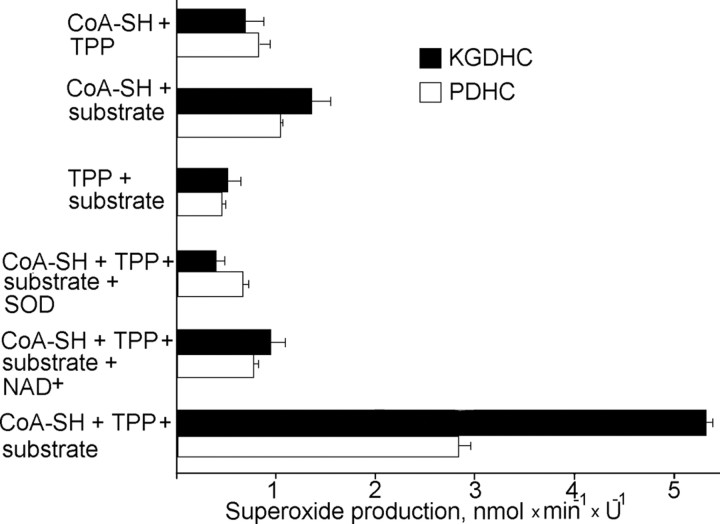
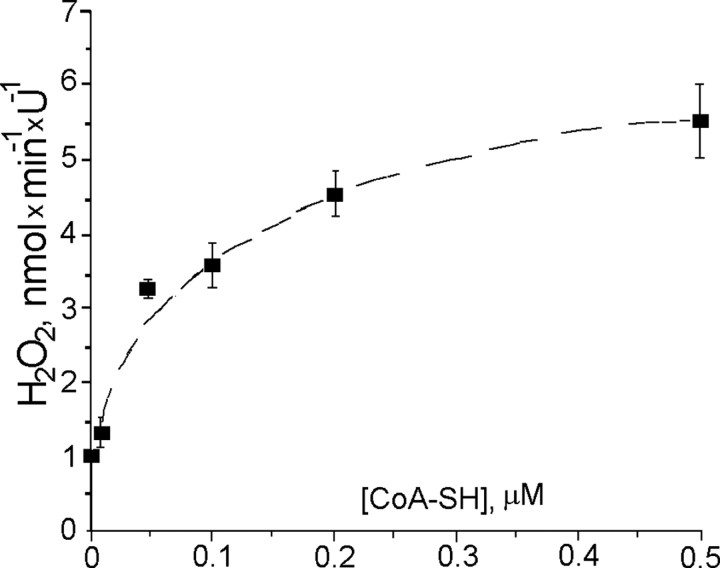
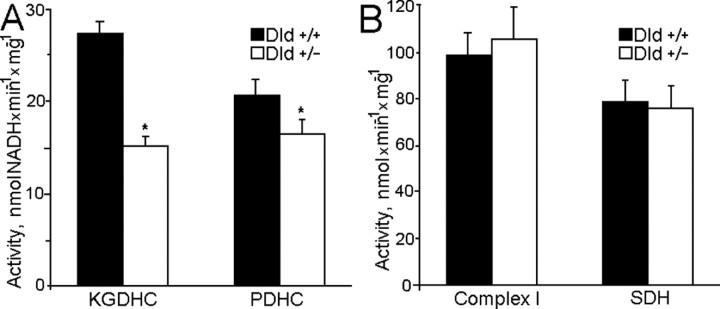
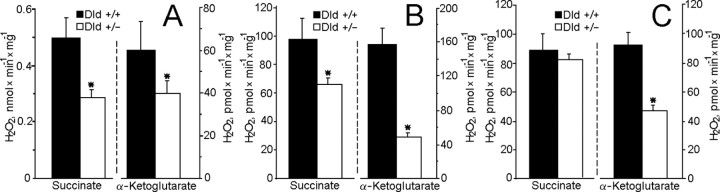
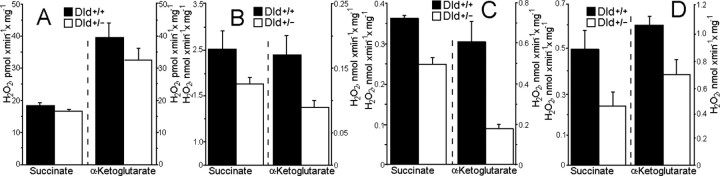
Mitochondria-produced reactive oxygen species (ROS) are thought to contribute to cell death caused by a multitude of pathological conditions. The molecular sites of mitochondrial ROS production are not well established but are generally thought to be located in complex I and complex III of the electron transport chain. We measured H(2)O(2) production, respiration, and NADPH reduction level in rat brain mitochondria oxidizing a variety of respiratory substrates. Under conditions of maximum respiration induced with either ADP or carbonyl cyanide p-trifluoromethoxyphenylhydrazone,alpha-ketoglutarate supported the highest rate of H(2)O(2) production. In the absence of ADP or in the presence of rotenone, H(2)O(2) production rates correlated with the reduction level of mitochondrial NADPH with various substrates, with the exception of alpha-ketoglutarate. Isolated mitochondrial alpha-ketoglutarate dehydrogenase (KGDHC) and pyruvate dehydrogenase (PDHC) complexes produced superoxide and H(2)O(2). NAD(+) inhibited ROS production by the isolated enzymes and by permeabilized mitochondria. We also measured H(2)O(2) production by brain mitochondria isolated from heterozygous knock-out mice deficient in dihydrolipoyl dehydrogenase (Dld). Although this enzyme is a part of both KGDHC and PDHC, there was greater impairment of KGDHC activity in Dld-deficient mitochondria. These mitochondria also produced significantly less H(2)O(2) than mitochondria isolated from their littermate wild-type mice. The data strongly indicate that KGDHC is a primary site of ROS production in normally functioning mitochondria.


Figures

Figure 1.
Figure 1.
H2O2 production by rat brain mitochondria oxidizing α-ketoglutarate or succinate. Medium (37°C) contained 125 mm KCl, 2 mm MgCl2, 0.2 mm EGTA, 2 mm KH2PO4, 10 mm HEPES, pH 7.2, 5 U/ml HRP, 20 U/ml superoxide dismutase, and 1 μm Amplex Red. Curve a, Rat brain mitochondria oxidizing succinate (10 mm); curves b and c, rat brain mitochondria oxidizing α-ketoglutarate. Additions included 0.25 mg/ml rat brain mitochondria (Mito), 5 mm α-ketoglutarate (α-Keto), 0.5 μm rotenone (Rot), 1 mm NAD+, 120 pmol/mg FCCP, and 1 μm antimycin (Ant.A). Numbers near the tracings indicate the rates of H2O2 production in picomoles per minute per milligram of mitochondrial protein. Typical tracings are shown.
Figure 2.
Figure 2.
A typical relationship between H2O2 production rates by rat brain mitochondria oxidizing various substrates and the corresponding levels of reduction mitochondrial pyridine nucleotides and the rates of respiration. A, ΔH2O2 production by rat brain mitochondria in state 4. ΔNADPH was obtained by measuring the difference in NADPH fluorescence both in the absence and in the presence of 160 pmol/mg FCCP. ΔNADPH in the presence of succinate was taken as 100%. H2O2 production in the presence of succinate was 1123 ± 71 pmol/min/mg (data not shown). The H2O2 production rate in the presence of FCCP was subtracted from that in the absence of the uncoupler and presented as ΔH2O2. B, ΔH2O2 production rate plotted against ΔNADPH in the presence of 1 μm rotenone. C, H2O2 production rate plotted against the rate of respiration by mitochondria in state 4. D, H2O2 production rate plotted against the rate of respiration by mitochondria in state 3. Incubation medium (see Fig. 1) was maintained at 37°C. For D only, state 3 respiration was initiated by adding 0.4 mm ADP to mitochondrial suspension. Substrates were present at the following concentrations: malate and glutamate, 5 mm plus 5 mm; α-ketoglutarate, 7 mm; succinate, 5 mm; citrate, 5 mm; pyruvate, 10 mm; glutamate, 5 mm; malate, 5 mm. Mitochondria were added at 0.5 mg/ml.
Figure 3.
Figure 3.
H2O2 production by permeabilized rat brain mitochondria. Incubation medium was composed of 225 mm mannitol, 75 mm sucrose, 10 mm HEPES-KOH, pH 7.4, 2 mm KH2PO4, 1 mm MgCl2, 0.25 mm EGTA, 48 μm thiamine, 5 U/ml HRP, 20 U/ml superoxide dismutase, and 1 μm Amplex Red (t = 37°C). Curve a, Mitochondria (Mito; 1 mg) were incubated for 5 min with 20 μg/mg alamethicin, then centrifuged at 20,000 × g for 10 min and resuspended at 0.5 mg/ml for H2O2 measurement; curve b, intact rat brain mitochondria; curve c, mitochondria were pretreated as in curve a; 0.25 mg/ml catalase was included into the incubation medium. Additions included 10 mm α-ketoglutarate (α-Ktg), 0.2 mm NAD+, 0.12 mm CoASH(CoA), 1 μm rotenone (Rot), and 20 μg/mg alamethicin (Ala).
Figure 4.
Figure 4.
Cofactor and substrate dependence of superoxide production by isolated KGDHC and PDHC. Superoxide production was measured as described in Materials and Methods. Incubation medium contained 50 mm KH2PO4 buffer, pH 7.8, 50 μm acetylated cytochrome c, 10 μm CaCl2, and 0.2 mm MgCl2, maintained at t = 37°C. Where indicated, 0.12 mm CoASH, 0.3 mm TPP, 40 U/ml superoxide dismutase (SOD), 2 mm NAD+, and either 10 mm ketoglutarate (for KGDHC) or 7 mm pyruvate (for PDHC) were included into the incubation medium (substrate). Reaction was started by adding 0.9-3.6 U/ml PDHC or 0.6-2.4 U/ml KGDHC.
Figure 5.
Figure 5.
CoA-SH dependence of H2O2 production by isolated KGDHC. H2O2 production was measured as described in Materials and Methods. Incubation medium contained 50 mm KH2PO4 buffer, pH 7.8, 10 μm CaCl2, 0.2 mm MgCl2, 0.3 mm TPP, 40 U/ml superoxide dismutase (SOD), 5 U/ml HRP, and 1 μm Amplex Red, maintained at t = 37°C. Medium was supplemented with 10 mm ketoglutarate.
Figure 6.
Figure 6.
Activity of selected mitochondrial enzymes in brain mitochondria isolated from Dld-deficient mice compared with their littermate controls. A, Activity of KGDHC and PDHC. B, Activity of complex I (NADH:Q1 reductase) and SDH. KGDHC, PDHC, and SDH activities were measured as described in Materials and Methods. Mitochondrial complex I was measured with frozen-thawed mitochondrial samples fluorimetrically by following coenzyme Q1-induced rotenone-sensitive NADH oxidation at 346 nm excitation and 460 nm emission. Incubation medium was composed of 125 mm KCl, 2 mm MgCl2, 2 mm KH2PO4, 0.2 mg/ml BSA, 10 μm CaCl2, 2 mm KCN, 50 μm NADH, 20 μg/ml alamethicin, and 0.08-0.09 mg/ml mitochondria, at t = 37°C. Reaction was started by adding 40 μm coenzyme Q1 and terminated by adding 1 μm rotenone. Complex I activity was calculated as the difference between the NADH oxidation rate in the presence and in the absence of rotenone and presented in nanomole of NADH per minute per milligram. The scale was calibrated by adding known amounts of freshly prepared NADH.
Figure 7.
Figure 7.
Hydrogen peroxide production by brain mitochondria isolated from Dld-deficient mice compared with their littermate wild-type mice. Incubation medium was as in Figure 1, except that EGTA was omitted and 0.4 mm ADP and 0.2 mg/ml BSA were included. Where indicated, 5 mm succinate or 5 mm α-ketoglutarate A were included into the medium. The sequence of additions was as follows: mitochondria (0.125 mg/ml) were added into the incubation medium and incubated for 2 min, then phosphorylation was inhibited with 1.2 μm carboxyatractylate and H2O2 production was measured as described in Materials and Methods (state 4); then 1 μm rotenone and, finally, 1 μm antimycin A were added into the incubation medium. A, H2O2 production in state 4. B, H2O2 production induced by rotenone. C, H2O2 production induced by antimycin A. In B for α-ketoglutarate only and in C for both α-ketoglutarate and succinate, the presented rate of H2O2 production was obtained by subtracting the rate of H2O2 production in state 4 from the rate induced by rotenone (B) and the rate in the presence of rotenone from that was induced by antimycin A (C).
Figure 8.
Figure 8.
The membrane potential of mouse brain mitochondria oxidizing succinate or α-ketoglutarate. Mouse brain mitochondria were isolated by the Percoll gradient procedure (see Materials and Methods). Incubation medium contained 125 mm KCl, 2 mm MgCl2, 2 mm KH2PO4, 10 mm HEPES, pH 7.2, 0.2 mg/ml BSA, 0.2 mm ADP, 5 mm succinate (A) or 5 mm α-ketoglurate (B), and 1 μm safranin O. Additions included 0.25 mg/ml mouse brain mitochondria (Mito), 1 μm rotenone (Rot), 1 μm carboxyatractylate (cAtr), and 1 μm antimycin A (Ant A). Typical tracings are shown. Solid lines, Dld+/+ mitochondria; dotted lines, Dld+/- mitochondria.
Figure 9.
Figure 9.
Hydrogen peroxide production by brain mitochondria isolated by the Percoll procedure from Dld-deficient mice compared with their littermate wild-type mice. Mouse brain mitochondria were isolated by the Percoll gradient procedure (see Materials and Methods). Incubation medium was as in Figure 8, except that safranin O was omitted and 5 U/ml HRP, 20 U/ml superoxide dismutase, and 1 μm Amplex Red were included. Where indicated, 5 mm succinate or 5 mm α-ketoglutarate A were included into the medium. The sequence of additions was as follows: mitochondria (0.1-0.125 mg/ml) were added into the incubation medium and incubated for 2 min, then phosphorylation was inhibited with 1.2 μm carboxyatractylate, then 1 μm rotenone and, finally, 1 μm antimycin A were added into the incubation medium. A, H2O2 production in state 3. B, H2O2 production in state 4. C, H2O2 production induced by rotenone. D, H2O2 production induced by antimycin A. In C for α-ketoglutarate only and in D for both α-ketoglutarate and succinate, the presented rate of H2O2 production was obtained by subtracting the rate of H2O2 production in state 4 from the rate induced by rotenone (C) and the rate in the presence of rotenone from that induced by antimycin A (D).
Figure 10.
Figure 10.
Coenzyme Q9 and coenzyme Q10 content in brain mitochondria isolated from Dld-deficient mice compared with their littermate wild-type mice. Coenzymes Q9 and Q10 were measured by HPLC as described in Materials and Methods. Data are presented in picomole of quinone per milligram of mitochondria.

Similar articles

Cited by

References

    1. Arrigoni O, Singer TP (1962) Limitations of the phenazine methosulphate assay for succinic and related dehydrogenases. Nauchni Tr Vissh Med Inst Sofiia 193: 1256-1258. - PubMed
    1. Azzi A, Montecucco C, Richter C (1975) The use of acetylated ferricytochrome c for the detection of superoxide radicals produced in biological membranes. Biochem Biophys Res Commun 65: 597-603. - PubMed
    1. Barja G (1999) Mitochondrial oxygen radical generation and leak: sites of production in states 4 and 3, organ specificity, and relation to aging and longevity. J Bioenerg Biomembr 31: 347-366. - PubMed
    1. Boveris A, Chance B (1973) The mitochondrial generation of hydrogen peroxide. General properties and effect of hyperbaric oxygen. Biochem J 134: 707-716. - PMC - PubMed
    1. Bunik VI (2003) 2-Oxo acid dehydrogenase complexes in redox regulation. Eur J Biochem 270: 1036-1042. - PubMed

Publication types

MeSH terms

Substances

LinkOut - more resources