Portrait of transcriptional responses to ultraviolet and ionizing radiation in human cells
- PMID: 15356296
- PMCID: PMC519099
- DOI: 10.1093/nar/gkh783
Portrait of transcriptional responses to ultraviolet and ionizing radiation in human cells
Abstract
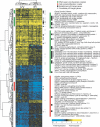
To understand the human response to DNA damage, we used microarrays to measure transcriptional responses of 10 000 genes to ionizing radiation (IR) and ultraviolet radiation (UV). To identify bona fide responses, we used cell lines from 15 individuals and a rigorous statistical method, Significance Analysis of Microarrays (SAM). By exploring how sample number affects SAM, we rendered a portrait of the human damage response with a degree of accuracy unmatched by previous studies. By showing how SAM can be used to estimate the total number of responsive genes, we discovered that 24% of all genes respond to IR and 32% respond to UV, although most responses were less than 2-fold. Many genes were involved in known damage-response pathways for cell cycling and proliferation, apoptosis, DNA repair or the stress response. However, the majority of genes were involved in unexpected pathways, with functions in signal transduction, RNA binding and editing, protein synthesis and degradation, energy metabolism, metabolism of macromolecular precursors, cell structure and adhesion, vesicle transport, or lysosomal metabolism. Although these functions were not previously associated with the damage response in mammals, many were conserved in yeast. These insights reveal new directions for studying the human response to DNA damage.
Figures

Similar articles
-
Significance analysis of microarrays applied to the ionizing radiation response.Proc Natl Acad Sci U S A. 2001 Apr 24;98(9):5116-21. doi: 10.1073/pnas.091062498. Epub 2001 Apr 17. Proc Natl Acad Sci U S A. 2001. PMID: 11309499 Free PMC article.
-
Microarray analysis of gene expression profiles of cardiac myocytes and fibroblasts after mechanical stress, ionising or ultraviolet radiation.BMC Genomics. 2005 Jan 18;6:6. doi: 10.1186/1471-2164-6-6. BMC Genomics. 2005. PMID: 15656902 Free PMC article.
-
Effects of DNA-targeted ionizing radiation produced by 5-[125I]iodo-2'-deoxyuridine on global gene expression in primary human cells.BMC Genomics. 2007 Jun 26;8:192. doi: 10.1186/1471-2164-8-192. BMC Genomics. 2007. PMID: 17594496 Free PMC article.
-
Transcriptional modulation induced by ionizing radiation: p53 remains a central player.Mol Oncol. 2011 Aug;5(4):336-48. doi: 10.1016/j.molonc.2011.06.004. Epub 2011 Jul 7. Mol Oncol. 2011. PMID: 21795128 Free PMC article. Review.
-
Integrating plant and animal biology for the search of novel DNA damage biomarkers.Mutat Res Rev Mutat Res. 2018 Jan-Mar;775:21-38. doi: 10.1016/j.mrrev.2018.01.001. Epub 2018 Jan 20. Mutat Res Rev Mutat Res. 2018. PMID: 29555027 Review.
Cited by
-
Focus on UV-Induced DNA Damage and Repair-Disease Relevance and Protective Strategies.Int J Mol Sci. 2020 Oct 1;21(19):7264. doi: 10.3390/ijms21197264. Int J Mol Sci. 2020. PMID: 33019598 Free PMC article. Review.
-
Whole-genome gene expression profiling reveals the major role of nitric oxide in mediating the cellular transcriptional response to ionizing radiation in normal human fibroblasts.Genomics. 2012 Nov;100(5):277-81. doi: 10.1016/j.ygeno.2012.07.007. Epub 2012 Jul 17. Genomics. 2012. PMID: 22814268 Free PMC article.
-
Local false discovery rate facilitates comparison of different microarray experiments.Nucleic Acids Res. 2009 Dec;37(22):7483-97. doi: 10.1093/nar/gkp813. Nucleic Acids Res. 2009. PMID: 19825981 Free PMC article.
-
BRCA1 haploinsufficiency leads to altered expression of genes involved in cellular proliferation and development.PLoS One. 2014 Jun 20;9(6):e100068. doi: 10.1371/journal.pone.0100068. eCollection 2014. PLoS One. 2014. PMID: 24950059 Free PMC article.
-
Gene expression profiling in MOLT-4 cells during gamma-radiation-induced apoptosis.Tumour Biol. 2012 Jun;33(3):689-700. doi: 10.1007/s13277-012-0329-z. Epub 2012 Feb 10. Tumour Biol. 2012. PMID: 22322922
References
-
- Holbrook N.J., Liu,Y. and Fornace,A.J.,Jr (1996) Signaling events controlling the molecular response to genotoxic stress. In Feige,U., Morimoto,R.I., Yahara,I. and Polla,B.S. (eds), Stress-Inducible Cellular Responses. Birkhauser/Springer, Vol. 77, pp. 273–288. - PubMed
-
- Friedberg E.C., Walker,G.C. and Siede,W. (1995) DNA Repair and Mutagenesis. ASM Press, Washington, DC.
-
- Nickoloff J.A. and Hoekstra,M.F. (1998) DNA Damage and Repair. Humana Press, Totowa, NJ.
-
- Mercier G., Denis,Y., Marc,P., Picard,L. and Dutreix,M. (2001) Transcriptional induction of repair genes during slowing of replication in irradiated Saccharomyces cerevisiae. Mutat. Res., 487, 157–172. - PubMed
Publication types
MeSH terms
Grants and funding
LinkOut - more resources
Full Text Sources
Other Literature Sources
Molecular Biology Databases

