. 2004 Sep 21;101(38):13879-84.
doi: 10.1073/pnas.0305789101. Epub 2004 Sep 8.

Marek's disease is a natural model for lymphomas overexpressing Hodgkin's disease antigen (CD30)

Affiliations

Marek's disease is a natural model for lymphomas overexpressing Hodgkin's disease antigen (CD30)

S C Burgess et al. Proc Natl Acad Sci U S A. .

Abstract

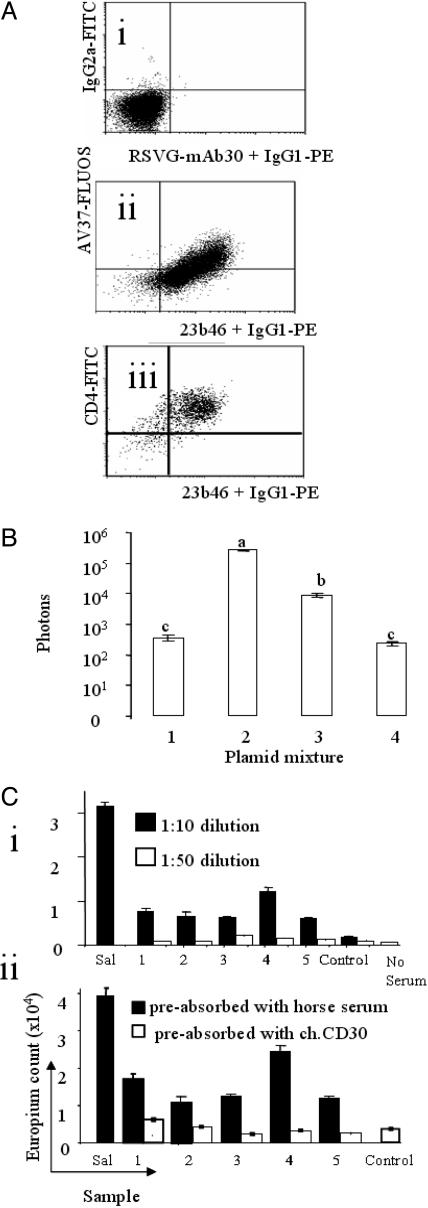
Animal models are essential for elucidating the molecular mechanisms of carcinogenesis. Hodgkin's and many diverse non-Hodgkin's lymphomas overexpress the Hodgkin's disease antigen CD30 (CD30(hi)), a tumor necrosis factor receptor II family member. Here we show that chicken Marek's disease (MD) lymphoma cells are also CD30(hi) and are a unique natural model for CD30(hi) lymphoma. Chicken CD30 resembles an ancestral form, and we identify a previously undescribed potential cytoplasmic signaling domain conserved in chicken, human, and mouse CD30. Our phylogeneic analysis defines a relationship between the structures of human and mouse CD30 and confirms that mouse CD30 represents the ancestral mammalian gene structure. CD30 expression by MD virus (MDV)-transformed lymphocytes correlates with expression of the MDV Meq putative oncogene (a c-Jun homologue) in vivo. The chicken CD30 promoter has 15 predicted high-stringency Meq-binding transcription factor recognition motifs, and Meq enhances transcription from the CD30 promoter in vitro. Plasma proteomics identified a soluble form of CD30. CD30 overexpression is evolutionarily conserved and defines one class of neoplastic transformation events, regardless of etiology. We propose that CD30 is a component of a critical intracellular signaling pathway perturbed in neoplastic transformation. Specific anti-CD30 Igs occurred after infection of genetically MD-resistant chickens with oncogenic MDV, suggesting immunity to CD30 could play a role in MD lymphoma regression.


Figures

Fig. 1.
Fig. 1.
Western blot of native (A) and reduced (B) antigen (≈70 kDa) expressed by HP9 cell line and identified by the mAb AV37.
Fig. 2.
Fig. 2.
Amino acid sequence alignment of chicken, human, and mouse CD30. Equals sign (=) indicates identity between all three sequences; – indicates biochemical similarity. TNFRSF repeats are marked above the sequence. Duplicated TNFRSF domains in human CD30 are labeled Hu′, and the position of their insertion is indicated by {DUP}. TM, transmembrane region. Dotted rectangle surrounds a TTRAP/TRAF6 region in mammalian CD30s. Solid rectangle surrounds a unique motif highly conserved between avian and mammalian CD30s (Table 2). TRAF 1, 2, and 3 binding motif is shown in bold. TRAF 1 and 2 motif is underlined.
Fig. 3.
Fig. 3.
Graphic representation of relationship between chicken, human, and mouse CD30. (A) Tree representing the genetic distance between selected TNFR superfamily repeats generated by using protdist and fitch programs from the phylip package (14). Leaves are labeled with TNFR number, species (C, chicken; H, human; M, mouse), and a domain number representing the order of domains in the sequences. Chicken domains are surrounded by rectangles, solid for CD30 (TNR8), dotted for others. Larger dotted rectangles contain nearest neighbors to the chicken CD30 repeats. Numbers in parentheses show the percentage of trees in the bootstrap analysis in which the repeats in these rectangles were in the same clade. The circle covers part of the tree where bootstrap values were all <50%. (B) Graphic representation of chicken, mouse, and human CD30 protein structures. Similar repeats are similarly shaded. Repeats are numbered from the N terminus with the proposed source of duplicated segments in parentheses.
Fig. 4.
Fig. 4.
CD30-Meq relationships and CD30 immunogeneicity. (A) Flow cytometry dot plots of nerve MD lymphoma cells. Negative control mAbs, IgG2a vs. RSVG-mAb30 (i). Chicken CD30 (mAb AV37) expression is proportional to MDV Meq expression (mAb 23b46) (ii), but not CD4 (iii). (B) Luciferase assay (mean of three replicates ± SEM) showing that MDV Meq protein can promote luciferase expression from a plasmid containing the CD30 promoter sequence 5′ to the luciferase (LUC) ORF (pCD30pLUC). SogE cells were transfected with plasmid mixtures containing pCD30pLUC (100 ng) (lane 1); the CMV promoter 5′ to LUC (100 ng; pBK-LUC, positive control) (lane 2); pCD30pLUC (100 ng) plus a plasmid encoding the Meq ORF 3′ to the CMV promoter (25 ng) (lane 3); and negative control plasmid pBK-CMV only (100 ng) (lane 4). A GFP-expressing plasmid (pd2EGFP, BD Biosciences; 50 ng) was used to normalize for differences in transfection efficiency. The plasmid pBK-CMV was added to all four transfection mixtures to give a total amount of plasmid DNA of 600 ng per well. P values are: a vs. b, <5 × 10⁻⁶; b vs. c, <5 × 10⁻⁷. (C) Chicken CD30-specific serum Ig after MDV HPRS-16 superinfection of genetically MD-resistant inbred chickens detected by dissociation enhanced lanthanide fluorescence immunoassay; chicken CD30-specific serum Ig titers could be diluted (i) and could be ablated by incubation with affinity-purified chicken CD30 but not horse serum (ii). Sal, Salmonella (positive control).
Fig. 5.
Fig. 5.
Comparison of chicken, mouse, and human CD30 genes. Intron/exon boundaries of the chicken CD30 gene were determined by comparison of cDNA sequence with unassembled shotgun genomic sequence (www.sanger.ac.uk). All introns started with GT and ended with AG. One ambiguity would allow lengths of 29 and 211 for exons 8 and 9, respectively. The exon structure of mouse and human genes was obtained from the ensembl database (www.ebi.ac.uk). Exons, shown by boxes, are numbered starting from the signal peptide encoding exon. Lengths of internal exons are shown below each box. The phase of each splice junction is shown by the number at the start of each intron. Braces indicate exons encoding transmembrane regions. Bars and arrow below the human gene show a duplication that occurred after the divergence of human and mouse from a common ancestor (see Supporting Text). Exons encoding TNFR repeats are indicated by dotted lines above each sequence. Human and mouse genes are variously annotated, sometimes with all or part of the fourth repeat that is clearly evident in the chicken sequence.

References

    1. Titcomb, C. P. J. (2001) J. Insur. Med. 33, 329–338. - PubMed
    1. National Cancer Institute Progress Review Group (2002) Strategic Plan for Addressing the Recommendations of the Leukemia, Lymphoma, and Myeloma Progress Review Group (National Institutes of Health, Bethesda).
    1. Chiarle, R., Podda, A., Prolla, G., Gong, J., Thorbecke, G. J. & Inghirami, G. (1999) Clin. Immunol. 90, 157–164. - PubMed
    1. Tarkowski, M. (1999) Arch. Immunol. Ther. Exp. (Warsz) 47, 217–221. - PubMed
    1. Epstein, M. A. (2001) Philos. Trans. R. Soc. London B 356, 413–420. - PMC - PubMed

Publication types

MeSH terms

Associated data