

Learning increases human electroencephalographic coherence during subsequent slow sleep oscillations
- PMID: 15356341
- PMCID: PMC518860
- DOI: 10.1073/pnas.0402820101
Learning increases human electroencephalographic coherence during subsequent slow sleep oscillations
Abstract
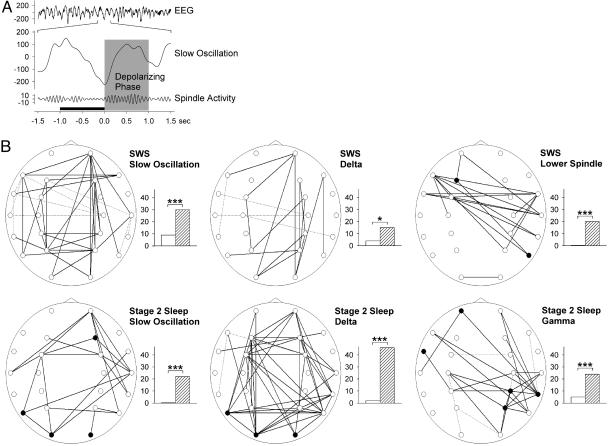
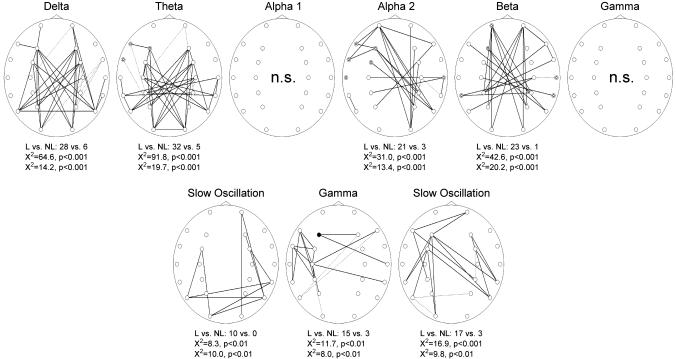
Learning is assumed to induce specific changes in neuronal activity during sleep that serve the consolidation of newly acquired memories. To specify such changes, we measured electroencephalographic (EEG) coherence during performance on a declarative learning task (word pair associations) and subsequent sleep. Compared with a nonlearning control condition, learning performance was accompanied with a strong increase in coherence in several EEG frequency bands. During subsequent non-rapid eye movement sleep, coherence only marginally increased in a global analysis of EEG recordings. However, a striking and robust increase in learning-dependent coherence was found when analyses were performed time-locked to the occurrence of slow oscillations (<1 Hz). Specifically, the surface-positive half-waves of the slow oscillation resulting from widespread cortical depolarization were associated with distinctly enhanced coherence after learning in the slow-oscillatory, delta, slow-spindle, and gamma bands. The findings identify the depolarizing phase of the slow oscillations in humans as a time period particularly relevant for a reprocessing of memories in sleep.
Figures
Similar articles
-
EEG Σ and slow-wave activity during NREM sleep correlate with overnight declarative and procedural memory consolidation.J Sleep Res. 2012 Dec;21(6):612-9. doi: 10.1111/j.1365-2869.2012.01017.x. Epub 2012 May 16. J Sleep Res. 2012. PMID: 22591117
-
Encoding difficulty promotes postlearning changes in sleep spindle activity during napping.J Neurosci. 2006 Aug 30;26(35):8976-82. doi: 10.1523/JNEUROSCI.2464-06.2006. J Neurosci. 2006. PMID: 16943553 Free PMC article.
-
Learning-dependent increases in sleep spindle density.J Neurosci. 2002 Aug 1;22(15):6830-4. doi: 10.1523/JNEUROSCI.22-15-06830.2002. J Neurosci. 2002. PMID: 12151563 Free PMC article. Clinical Trial.
-
Slow oscillations orchestrating fast oscillations and memory consolidation.Prog Brain Res. 2011;193:93-110. doi: 10.1016/B978-0-444-53839-0.00007-7. Prog Brain Res. 2011. PMID: 21854958 Review.
-
Temporal entrainment of cognitive functions: musical mnemonics induce brain plasticity and oscillatory synchrony in neural networks underlying memory.Ann N Y Acad Sci. 2005 Dec;1060:243-54. doi: 10.1196/annals.1360.017. Ann N Y Acad Sci. 2005. PMID: 16597771 Review.
Cited by
-
The Reuniens Nucleus of the Thalamus Has an Essential Role in Coordinating Slow-Wave Activity between Neocortex and Hippocampus.eNeuro. 2019 Oct 17;6(5):ENEURO.0365-19.2019. doi: 10.1523/ENEURO.0365-19.2019. Print 2019 Sep/Oct. eNeuro. 2019. PMID: 31548369 Free PMC article.
-
Sleep spindles and hippocampal functional connectivity in human NREM sleep.J Neurosci. 2011 Jul 13;31(28):10331-9. doi: 10.1523/JNEUROSCI.5660-10.2011. J Neurosci. 2011. PMID: 21753010 Free PMC article.
-
Visual-procedural memory consolidation during sleep blocked by glutamatergic receptor antagonists.J Neurosci. 2008 May 21;28(21):5513-8. doi: 10.1523/JNEUROSCI.5374-07.2008. J Neurosci. 2008. PMID: 18495885 Free PMC article. Clinical Trial.
-
Minimizing ICU Neurological Dysfunction with Dexmedetomidine-induced Sleep (MINDDS): protocol for a randomised, double-blind, parallel-arm, placebo-controlled trial.BMJ Open. 2018 Apr 20;8(4):e020316. doi: 10.1136/bmjopen-2017-020316. BMJ Open. 2018. PMID: 29678977 Free PMC article. Clinical Trial.
-
Intranasal Dexmedetomidine for the Management of Preoperative Anxiety-Related Insomnia: A Randomized, Three-Blinded, Clinical Trial Compared with Lorazepam and Placebo.Drug Des Devel Ther. 2024 Dec 17;18:6061-6073. doi: 10.2147/DDDT.S487463. eCollection 2024. Drug Des Devel Ther. 2024. PMID: 39717197 Free PMC article. Clinical Trial.
References
-
- McGaugh, J. L. (2000) Science 287, 248–251. - PubMed
-
- Müller, G. E. & Pilzecker, A. (1900) Z. Psychol., Suppl. 1, 1–300.
-
- McNaughton, B. L., Barnes, C. A., Battaglia, F. P., Bower, M. R., Cowen, S. L., Ekstrom, A. D., Gerrard, J. L., Hoffman, K. L., Houston, F. P., Karten, Y. et al. (2003) in Sleep and Brain Plasticity, eds. Maquet, P., Smith, C. & Stickgold, R. (Oxford Univ. Press, New York), pp. 225–246.
-
- Maquet, P. (2001) Science 294, 1048–1052. - PubMed
-
- Stickgold, R., Hobson, J. A., Fosse, R. & Fosse, M. (2001) Science 294, 1052–1057. - PubMed
Publication types
MeSH terms
LinkOut - more resources
Full Text Sources
