. 2004 Jun;5(2):153-70.
doi: 10.1007/s10162-003-4036-8.

Onset neurones in the anteroventral cochlear nucleus project to the dorsal cochlear nucleus

Affiliations

Onset neurones in the anteroventral cochlear nucleus project to the dorsal cochlear nucleus

Robert H Arnott et al. J Assoc Res Otolaryngol. 2004 Jun.

Abstract

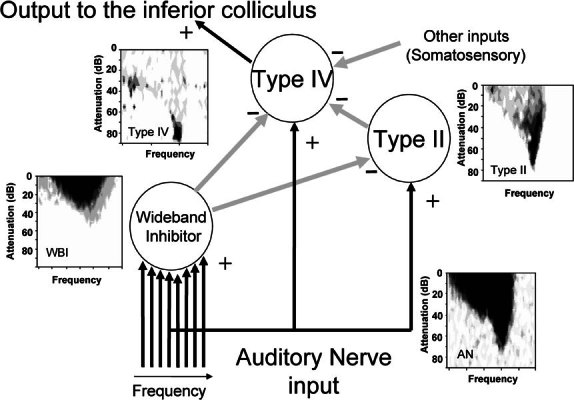
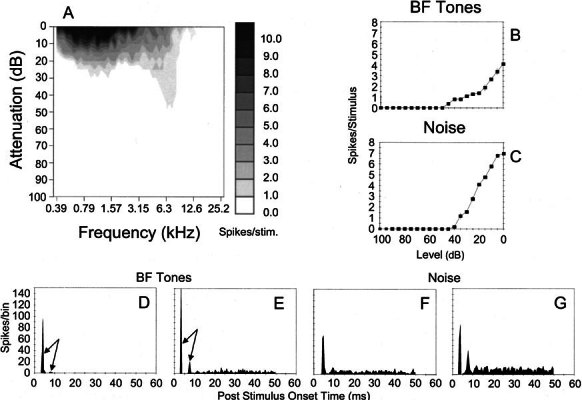
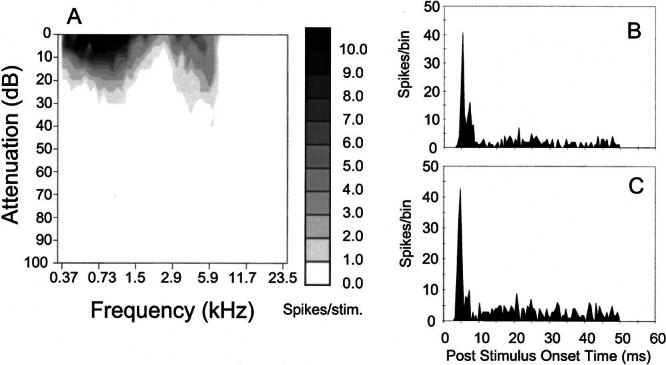
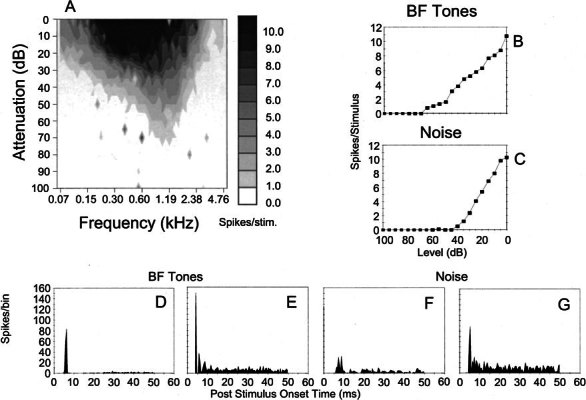
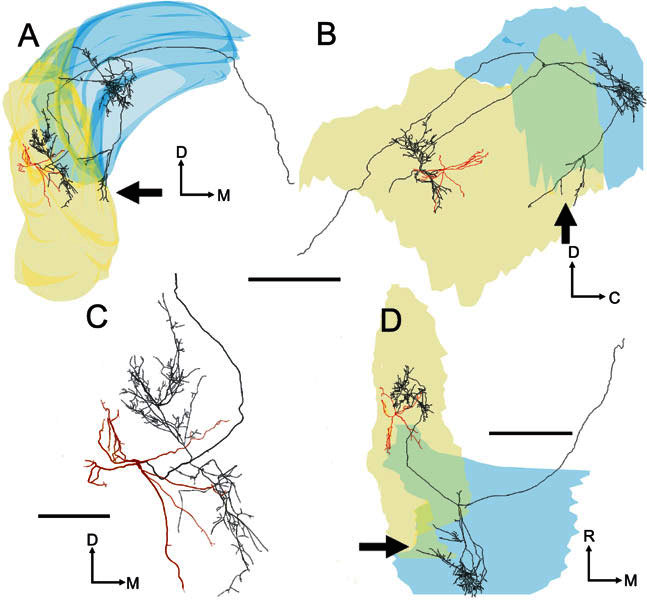
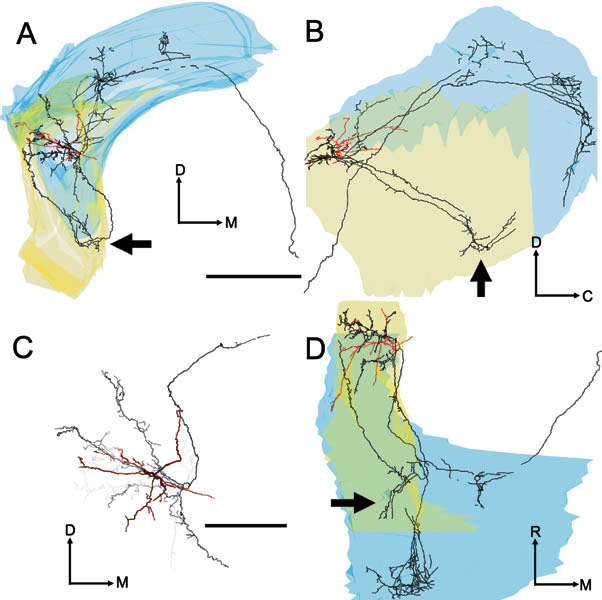
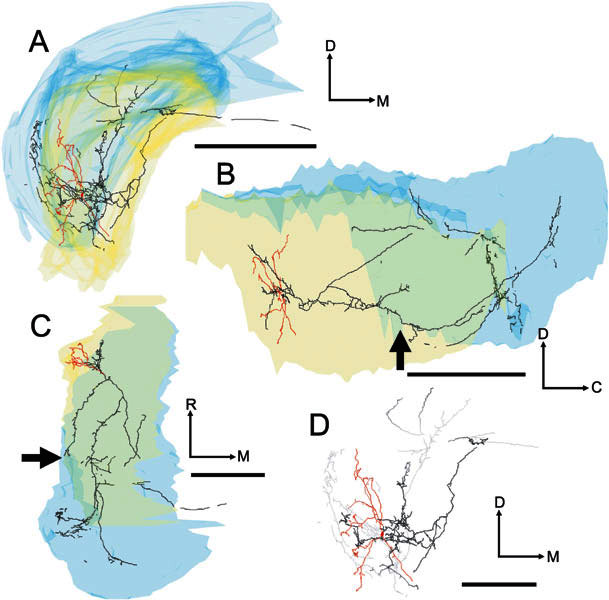
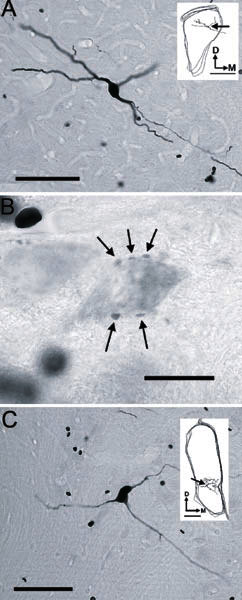
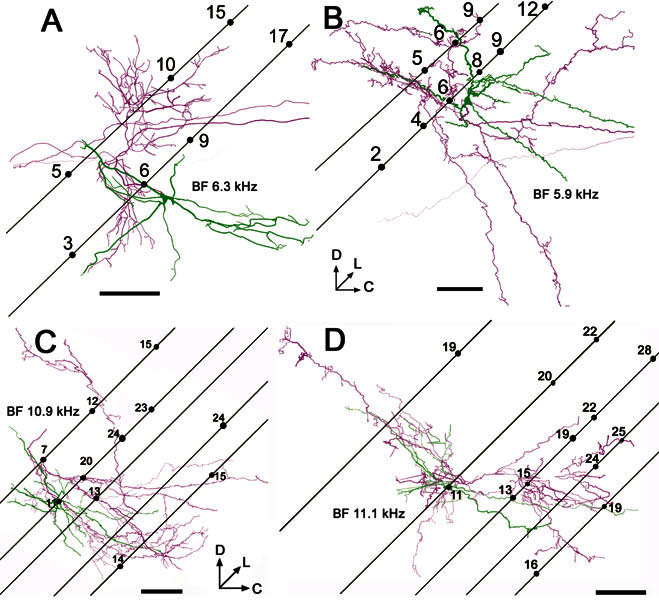
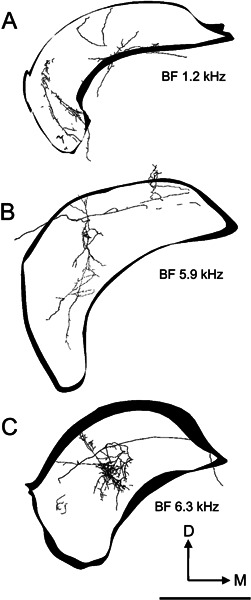
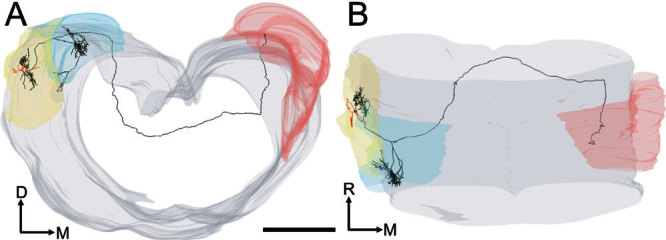
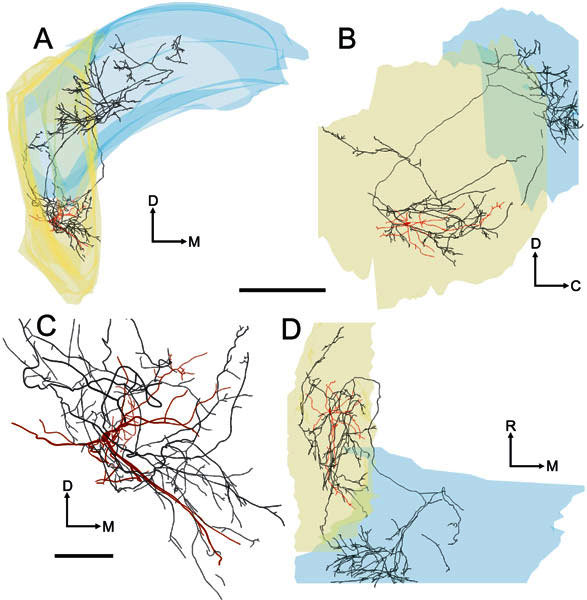
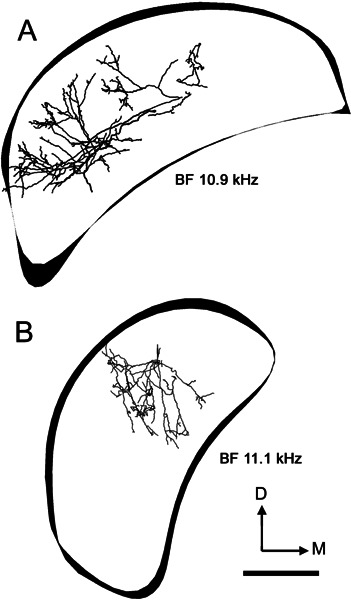
Considerable circumstantial evidence suggests that cells in the ventral cochlear nucleus, that respond predominantly to the onset of pure tone bursts, have a stellate morphology and project, among other places, to the dorsal cochlear nucleus. The characteristics of such cells make them leading candidates for providing the so-called "wideband inhibitory input" which is an essential part of the processing machinery of the dorsal cochlear nucleus. Here we use juxtacellular labeling with biocytin to demonstrate directly that large stellate cells, with onset responses, terminate profusely in the dorsal cochlear nucleus. They also provide widespread local innervation of the anteroventral cochlear nucleus and a small innervation of the posteroventral cochlear nucleus. In addition, some onset cells project to the contralateral dorsal cochlear nucleus.


Figures

Figure 1
Figure 1
The proposed network of cells in the cochlear nucleus that result in type IV principal cells being highly responsive to the frequency position of sharp spectral notches (Young and Davis 2002). Black (+) arrows indicate excitatory connections while gray (—) arrows show inhibitory connections. Typical frequency response areas for each cell type are shown; these are from real recordings and are for illustration of the shape only. Note that the full extent of the wideband inhibitor response area is rarely revealed by single-tone stimulation.
Figure 2
Figure 2
Physiological characteristics of unit 282 (BF-6.3 kHz) identified as an On-C type. A Frequency response area showing the distribution of spikes as a function of stimulus frequency (abscissa) and level (ordinate). B, C Discharge rate versus level function showing mean (±SEM) number of discharges per stimulus. The ordinate shows attenuation in decibels below maximum output (approximately 100 dB SPL) for BF tones (B) and broadband noise (C). D, E PSTHs compiled from 150 presentations of 50 ms BF tone bursts, which were delivered at 20 dB and 50 dB suprathreshold. Binwidth-1 ms. F, G Similar PSTHs compiled from responses to bursts of broad band noise delivered with 20 dB and 0 dB of stimulus attenuation (cf. C).
Figure 3
Figure 3
Physiological characteristics of unit 212 (BF-5.9 kHz) identified as an On-C type. A Frequency response area. B, C PSTHs compiled from responses to 150 presentations of 50 ms BF tones at 20 dB and 30 dB suprathreshold.
Figure 4
Figure 4
Physiological characteristics of unit 249 (BF-1.2 kHz) identified as an On-C type. A Frequency response area. B, C Discharge rate versus level function showing mean (±SEM) number of discharges per stimulus. The ordinate shows attenuation in decibels below maximum output for BF tones (B) and broadband noise (C). D, E PSTHs compiled from 150 presentations of 50 ms BF tone bursts, which were delivered at 20 dB and 50 dB suprathreshold. Binwidth-1 ms. F, G Similar PSTHs compiled from responses to bursts of broadband noise delivered with 30 dB and 10 dB of stimulus attenuation (cf. C).
Figure 5
Figure 5
Three-dimensional tracing of the soma and dendrites (red) and the axon (black) of the On-C cell (unit 282, BF-6.3 kHz) related to the outlines of the left cochlear nucleus (rendered semitransparently). The surface rendering of DCN (blue) and VCN (yellow) overlaps in places to form a denser color. A Transverse view seen from the caudal pole. B Sagittal view seen from the lateral aspect. C Higher-power transverse view showing the dendrites and local axon in high-quality mode which represents the actual thickness of the axon and dendrites. D Plan view looking down on the dorsal surface. In this (A, B, and D) and similar tracings, the neuronal processes are rendered with disproportionate, uniform thickness so that they are visible within the small-scale drawings of the cochlear nucleus. The main axon crosses the midline (Fig. 11), while other branches form a varicose arbor in the ipsilateral DCN (Fig. 10C). A few fibers also terminate in the posterior VCN (see arrows). Scale bar for A, B, D = 1000 μm and for C = 250 μm. Abbreviations for this and subsequent figures: C, caudal; D, dorsal; M, medial; R, rostral.
Figure 6
Figure 6
Four images of the soma and dendrites (red) and the axon (black) of the On-C cell (unit 212, BF-5.9 kHz). A Transverse view. B Sagittal view. C Higher-power transverse view showing the dendrites and local axon in high-quality mode and with “depth cueing” switched on. Processes rostral to the soma become increasingly pale with increasing distance away from the soma. D Plan view. Scale bar for A, B, D = 1000 μm and for C = 500 μm. The axonal branch which directly innervates the caudal PVCN is clearly visible in all three orientations of the tracing (see arrows). This pattern contrasts with the course taken by the PVCN innervation of unit 282 (Fig. 5), which had similar BF but was located more caudally in AVCN.
Figure 7
Figure 7
Four images of the soma and dendrites (red) and axon (black/gray) of unit 249 (BF-1.2 kHz). A Transverse view. B Sagittal view. C Plan view. D Higher-power transverse view showing the dendrites and local axon in high-quality mode and with “depth cueing” switched on. Scale bar for A, B, C = 1000 μm and for D = 500 μm. A branch of the local axonal arbor passed through ventral PVCN, where it gave rise to a small plexus of terminating fibers (see arrows), en passage to the most ventrolateral part of the ipsilateral DCN. In common with the other On-C neurones in our sample, it was possible to trace a stained axon in the DAS which projected toward the midline.
Figure 8
Figure 8
A Photomicrograph of the soma of On-C unit number 212 (BF-5.9 kHz) showing the thin axon arising from the ventral dendrite; scale bar = 100 μm. Inset is a tracing of three sequential sections of AVCN. The position of the soma is indicated by the arrow; inset scale bar = 500 μm. B Pale soma in PVCN, revealed by background staining, which is surrounded by a number of stained boutons (arrows). Scale bar = 20 μm. C Photomicrograph showing the soma and proximal processes of On-L unit 284 (BE-10.9 kHz); scale bar = 100 μm. Inset shows the position of the soma (arrow) and local processes of the neurone within the traced outline of the CN. Inset scale bar = 200 μm.
Figure 9
Figure 9
Reconstructions of the soma and dendrites (green) and the proximal axon (magenta) of onset units viewed in the sagittal plane. In each case, the positions of associated electrode tracks are superimposed to indicate the frequency gradient within AVCN. The electrodes were inserted at 45° relative to the horizontal stereotaxic plane (as defined by Rapisarda and Bacchelli 1977), and the angle of the tracks was found by reconstructing them along with the labeled cells. Subsequently, for these four cells the orientation was defined in relation to the electrode tracks and not to the histological section. Some tracks were clearly visible over part of their course because of blood entering them after removal of the electrode. Numbers on the tracks indicate the BFs of recorded units in kHz. The reconstructed images are shown with “depth cueing” so that processes that are deep to the plane of the figure become increasingly faint, while processes that come out of the page toward the viewer are made darker. A On-C unit 282, BF-6.3 kHz B On-C unit 212, BF-5.9 kHz; C On-L unit 284, BF-10.9 kHz; D On-L unit 286, BF-11.1 kHz. In this figure neuronal processes are rendered with their fiber thickness in correct proportion. Scale bars = 200 μm.
Figure 10
Figure 10
Reconstructions of the innervation of the left (ipsilateral) DCN by axonal processes arising from three On-C cells. The outlines of the DCN are included to indicate orientation; they are shown for a very constrained rostrocaudal segment of the nucleus, whereas the flattened three-dimensional tracing of the whole of the DCN innervation is shown. In all three examples, the axonal termination occupies approximately one-third of the mediolateral extent of the nucleus while extending across virtually its entire dorsoventral thickness. In our current data, all but the most superficial part of DCN receives afferent input from On-C type neurones. A DCN termination of unit 249. The majority of the axonal termination is in the ventrolateral part of DCN. Neurones recorded in this part of DCN generally exhibit low BFs. B DCN termination of unit 212. The majority of the termination is in the central region of DCN, which is associated with middle-frequency neurones in DCN recording studies. C The DCN termination of unit 282 also occurs in the central region of the nucleus but is more restricted than the termination of unit 212. In these tracings, as in Figure 9, neuronal processes are rendered with their thickness correctly proportioned. Scale bar = 1000 μm.
Figure 11
Figure 11
Two views of the same tracing of unit 282 (BF-6.3 kHz). A Partially rotated coronal view of the brain stem including the left and right cochlear nuclei. The axon (black) arose from the base of one of the dendrites (red) and projected into the ipsilateral DCN (blue outline on left) giving rise en route to a branch which coursed rostrally and medially. B Top view of the same tracing showing the path of the axon as it innervated both the left (ipsilateral) and right (red surface contours) dorsal cochlear nuclei. Scale bar = 1000 μm.
Figure 12
Figure 12
Physiological characteristics of unit 284 (BF-10.9 kHz) identified as an On-L type. A Frequency response area. B, C Discharge rate versus level function showing mean (±SEM) number of discharges per stimulus. The ordinate shows attenuation in decibels below maximum output for BF tones (B) and broadband noise (C). D, E PSTHs compiled from 150 presentations of 50 ms BF tone bursts, which were delivered at 20 dB and 50 dB suprathreshold. Binwidth-1 ms. F, G Similar PSTHs compiled from responses to bursts of broadband noise delivered with 20 dB and 0 dB of stimulus attenuation (cf. C).
Figure 13
Figure 13
Four images of the soma and dendrites (red) and the axon (black) of the On-L cell (unit 284, BF-10.9 kHz). A Transverse view. B Sagittal view. C Higher-power transverse view showing the dendrites and local axon in high-quality mode. D Plan view. Scale bar for A, B, D = 1000 μm and for C = 250 μm. Like the On-C neurones, this cell gave rise to a profuse local axonal innervation. Additionally, the cell gave rise to an axonal branch that terminated in the caudal part of PVCN. The locally ramifying axon gave rise to two further branches, one of which entered and branched profusely in the ipsilateral DCN. In contrast to our On-C cells, the second axonal branch terminated in the rostral AVCN. Also, in contrast to our On-C cells, there is no evidence of a projection beyond the ipsilateral CN.
Figure 14
Figure 14
Reconstructions of the innervation of the left (ipsilateral) DCN by axonal processes arising from two On-L cells. The outlines of three sections of the DCN are included to indicate orientation. A Unit 284. B Unit 286. Scale bar = 500 μm.

Similar articles

Cited by

References

    1. Adams JC. Ascending projections to the inferior colliculus. J. Comp. Neurol. 1979;183:519–538. - PubMed
    1. Alibardi L. Ultrastructural and immunocytochemical characterisation of commissural neurons in the ventral cochlear nucleus of the rat. Anat. Anz. 1998;180:427–438. - PubMed
    1. Alibardi L. Cytology, synaptology and immunocytochemistry of commisural neurons and their putative axonal terminals in the dorsal cochlear nucleus of the rat. Anat. Anz. 2000;182:207–220. - PubMed
    1. Alibardi L. Fine structure and neurotransmitter cytochemistry of neurons in the rat ventral cochlear nucleus projecting to the ipsilateral dorsal cochlear cochlear nucleus. Anat. Anz. 2001;183:459–469. - PubMed
    1. Babalian AL, Ryugo DK, Vischer MW, Rouiller EM. Inhibitory synaptic interactions between cochlear nuclei: evidence from an in vitro whole brain study. Neuroreport. 1999;10:1913–1917. - PubMed

LinkOut - more resources