. 2004 Nov 15;561(Pt 1):109-22.
doi: 10.1113/jphysiol.2004.074252. Epub 2004 Sep 9.

NG2-positive cells in the mouse white and grey matter display distinct physiological properties

Affiliations

NG2-positive cells in the mouse white and grey matter display distinct physiological properties

R Chittajallu et al. J Physiol. .

Abstract

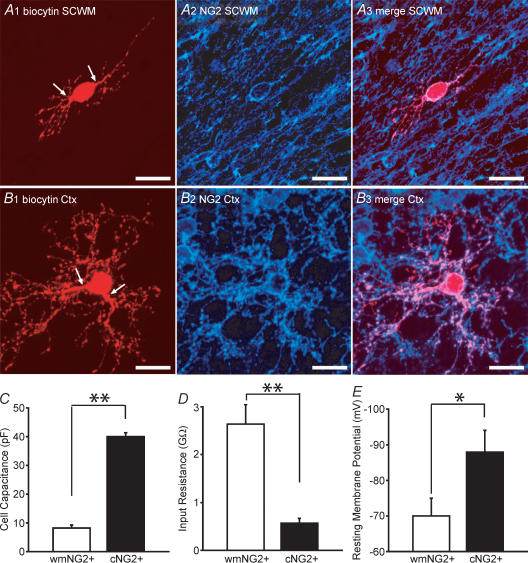
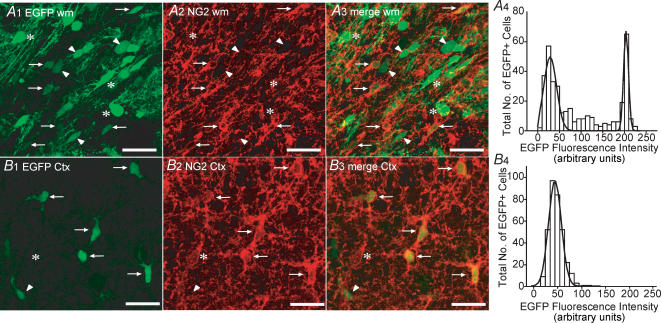
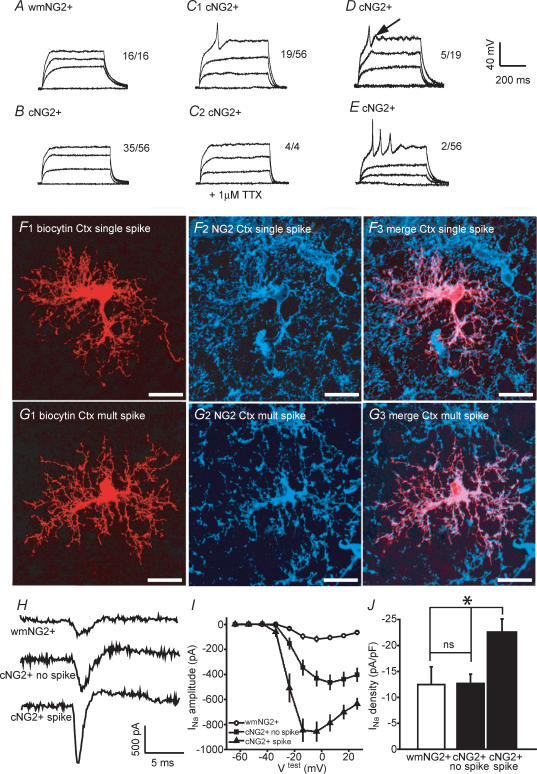
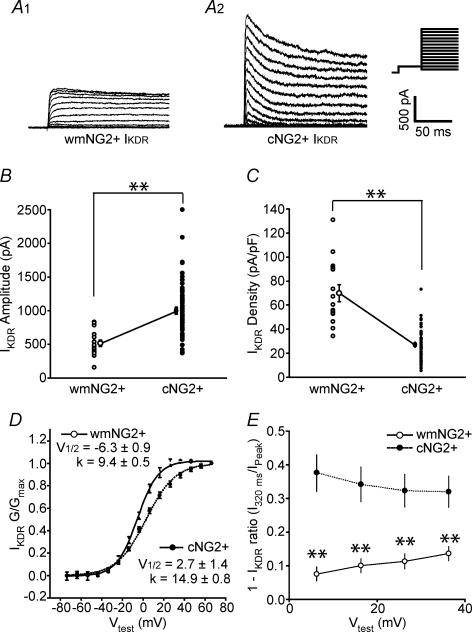
Cells that express the NG2 proteoglycan are the largest proliferative progenitor population in the postnatal central nervous system (CNS). Although this entire population has long been considered to be oligodendrocyte progenitors, numerous NG2(+) cells are present in the cerebral cortex, where relatively little myelination occurs, and also persist long after myelination is complete in the CNS. Several studies have alluded to the presence of distinct NG2(+) cell subtypes based on marker expression, but no experimentally derived hypotheses about the physiological role of these subtypes has been proposed. In the current study, whole-cell patch-clamp data from acutely isolated slices demonstrate that subcortical white matter and cortical NG2(+) cells display distinct membrane properties in addition to possessing differing K(+)- and Na(+)-channel expression profiles. A striking observation is that a subpopulation of cortical, but not white matter NG2(+) cells, elicit depolarization-induced spikes that are akin to immature action potentials. Our data demonstrate that a population of cortical NG2(+) cells display physiological properties that differ from their white matter counterparts.


Figures

Figure 2
Figure 2. Distinct morphology and membrane properties of white matter NG2+ and cortical NG2+ cells
A1, a low fluorescence intensity white matter (wm) EGFP+ cell after biocytin injection, followed by rhodamine conjugation. The cell has a bipolar morphology (arrows indicate processes). A2–A3, this cell was NG2+ and was morphologically representative of the EGFP+/white matter NG2+ cells identified. B1, cortical EGFP+ cell processed with the same protocol as in A1. Although the cell body is a similar size to the white matter NG2+, a distinct arborization of processes is apparent. B2–B3, this cell was also found to be NG2+. C and D, measurement of whole-cell capacitances, input resistances in white matter NG2+ (open bars; n = 28) and cortical NG2+ cells (filled bars; n = 40). E, resting membrane potential in white mater NG2+ (open bars; n = 7) and cortical NG2+ cells (filled bars; n = 10). Scale bars, 20 μm. All data was obtained from P5–P8 CNP-EGFP mice. *P < 0.05, **P < 0.01 Mann-Whitney U test.
Figure 1
Figure 1. Co-localization of EGFP fluorescence and NG2 immunoreactivity in P8 subcortical white matter and cortex
A1, confocal image (z = 18 μm) of white matter (wm) from a coronal slice of a P8 CNP-EGFP mouse. Note differences in EGFP fluorescent intensity (arrows/arrowheads versus asterisks). A2 and A3, immunostaining with anti-NG2 shows a proportion of white matter EGFP+ cells are positive for NG2 (arrows). A4, Gaussian analysis of EGFP+ fluorescent intensity frequency distribution. B1, confocal image (z = 18 μm) of cortex (Ctx) in the same coronal slice using identical imaging parameters as in panel A1. Cortical EGFP+ cells display a distinct morphology (see also Fig. 2 A and B) to those found in white matter. B2 and B3, the majority of cortical EGFP+ cells express NG2 (arrows; arrowhead indicates the single cortical EGFP+/NG2-negative cell found in this field). In addition we also noted a small percentage (1–2%) of NG2+ cells that do not express detectable EGFP levels (asterisk). B4, only one population of EGFP+ cells with respect to fluorescence intensity is seen in cortex. Data for the EGFP fluorescence intensity analysis (bin size = 10) was derived from 3 separate P8 CNP-EGFP mice. The total number of cells analysed in white matter and cortex was 363 and 333, respectively, from multiple microscopic fields (4–12). Scale bars, 50 μm.
Figure 5
Figure 5. A subpopulation of cortical NG2+, but not white matter NG2+ cells, display TTX-sensitive spikes in response to depolarizing current pulses
A, representative current clamp traces from a single white matter (wm) NG2+ cell in response to membrane depolarization (current steps in single example were 30, 60 and 90 pA; total no. of cells tested, 16). B and C, from a total of 56 cortical (c) NG2+ cells tested, 35 showed no membrane response (see B for single example; current steps were 15, 30 and 45 pA), and 19 displayed a single spike occurring at the beginning of the test pulse (see C1 for single example; current steps were 10, 20 and 30 pA). In all 4 of these 19 cells tested, the spike was abolished by 1 μm TTX (see C2 for single example; current steps were 10, 20 and 30 pA). D, 5 out of the 19 spike-producing cortical NG2+ cells also clearly displayed an after-depolarization (see arrow; current steps were 15, 30 and 45 pA). E, single example of a cortical NG2+ cell that displayed multiple spikes (2 cells were found with this response; current steps were 10, 20 and 30 pA). In all cells, current injections were in 10–30 pA steps for 450 ms duration with a maximum depolarization to approximately 0 mV. F and G, morphology and confirmation of NG2+ expression in single and multiple spiking cells, respectively. H, single trace examples of INa in a white matter NG2+ cell (top trace), a cortical NG2+ cell not displaying a spike (middle trace) and a cortical NG2+ cell with spike (bottom trace) I, voltage–current relationships of INa for white matter NG2+ cells (open circle; n = 5), and for cortical NG2+ cells without and with spike (filled circles and filled triangles; n = 10 and 9, respectively). The average uncompensated series resistance for recordings from the three cell groups was not significantly different (33 ± 4, 36 ± 2, 35 ± 3 MΩ, respectively). Note that prior to recordings series resistance compensation of at least 85% was performed. J, corresponding pooled INa densities (n = 5–10). All data were obtained from P5–P8 CNP-EGFP mice. Scale bars, 20 μm *P < 0.05, ns, not significant (i.e. P > 0.05), Mann-Whitney U test.
Figure 3
Figure 3. Expression of IKDR by white matter NG2+ and cortical NG2+ cells
A1 and A2, representative examples of IKDR activation from a white matter (wm) NG2+ and cortical (c) NG2+ cell in response to a series of depolarizing voltage steps from −60 mV to 80 mV after a pre-pulse to −40 mV to inactivate IKA; 10 mV increments; holding potential was −80 mV (see inset; note all values are prior to junction potential correction) B, pooled data of IKDR amplitude measured at steady state (180 ms after a test pulse to +50 mV). C, pooled data of IKDR density. In B and C, open and filled circles are data from all white matter NG2+ (n = 22) and cortical NG2+ (n = 74) cells, respectively. Circles with s.e.m. are the corresponding mean values. The average uncompensated series resistance for recordings from the two cell groups was not significantly different (33 ± 2 and 35 ± 2 MΩ for white matter NG2+ and cortical NG2+ cells, respectively). Note that prior to recordings series resistance compensation of at least 85% was performed. D, activation–conductance profiles and single Boltzmann curve fits for IKDR from white matter NG2+ (open circles; continuous line; n = 16) and cortical NG2+ cells (filled circles; dotted line; n = 24). Calculated half-activation and slope values were significantly different between the two groups (P < 0.01; Mann-Whitney U test). E, inactivation of IKDR during varying test pulses was measured. Open and filled circles indicate white matter NG2+ and cortical NG2+ cells, respectively (data are from 16 white matter NG2+ and 24 cortical NG2+ cells). All data were obtained from P5–P8 CNP-EGFP mice. **P < 0.01 Mann-Whitney U test.
Figure 4
Figure 4. Expression of IKA and IKir by white matter NG2+ and cortical NG2+ cells
A, representative examples of IKA activation from a white matter (wm) NG2+ (left panel) and cortical (c) NG2+ (right panel) cell in response to a series of depolarizing voltage steps (IKA was isolated by digitally subtracting traces obtained as described in Fig. 3 from traces following a pre-pulse to −110 mV; voltage steps from −60 mV to 80 mV; 10 mV increments (see inset; note all values are prior to junction potential correction). B, individual and pooled data points (with s.e.m.) of IKA peak amplitude. C, corresponding IKA densities (n = 10 and 28 for white matter NG2+ and cortical NG2+ cells, respectively). The average uncompensated series resistance for recordings from the two cell groups was not significantly different (32 ± 3 and 35 ± 3 MΩ for white matter NG2+ and cortical NG2+ cells, respectively). Note that prior to recordings series resistance compensation of at least 85% was performed. D, activation–conductance profiles and single Boltzmann curve fit for IKA from white matter NG2+ (n = 9) and cortical NG2+ cells (n = 15). Calculated half-activation and slope values were not significantly different (P > 0.05). Notation of open and filled circles is the same as in Fig. 3. E and F, representative single current traces in response to a ramp protocol (see inset) in the absence (control) and presence of 5 mm extracellular Cs+ (+Cs+; 1 min after application) from a white matter NG2+ and cortical NG2+ cell, respectively. G, isolation of Cs+-sensitive component by subtraction of traces in E and F. H, pooled data for the IKir density in white matter NG2+ (n = 8; open circles) and cortical NG2+ cells (n = 65; filled circles). Corresponding mean values are shown with s.e.m. The average uncompensated series resistance for the two populations of cells was not significantly different (30 ± 4 and 32 ± 2 MΩ for white matter NG2+ and cortical NG2+ cells, respectively). Note that prior to recordings series resistance compensation of at least 85% was performed. All data were obtained from P5–P8 CNP-EGFP mice. **P < 0.01, ns, not significant (P > 0.05) Mann-Whitney U test.
Figure 6
Figure 6. Cortical NG2+ cells express functional AMPA receptor channels but rarely display spontaneous AMPA receptor activation
Cortical NG2 cells were voltage clamped at −80 mV and the holding current was continuously monitored. The extracellular solution was supplemented with 10 mm TEA, 1 mm 4-aminopyridine, 50 μm picrotoxin, 1 μm tetrodotoxin and 50 μm APV. A, brief application of 30 μm kainate (KA; 1 min) elicited an inward current which returned to 95% of control value following washout. B, the kainite-induced inward current was severely attenuated in the presence of 10 μm NBQX (added 1 min prior to and during the 1 min KA application). C, 100 μm cyclothiazide (CTZ; added 2 min prior to and during the KA application) markedly increased the KA-induced inward current. D, pooled data for inward currents induced by KA (n = 9) in the presence of NBQX (n = 4) and CTZ (n = 4). Data are means ± s.e.m. E, 2 out of 36 spiking cortical NG2+ cells displayed spontaneous inward currents following application of pardaxin (2 μm). This panel displays one of these cells. Top panel shows the spike response to depolarizing current injection under current clamp (30 and 60 pA injections). The bottom panel shows continuous traces under voltage clamp (holding potential −80 mV) following a 10 min application of 2 μm pardaxin. Note the traces are not consecutive. The traces denoted by filled circles are in the additional presence of 10 μm NBQX (10 min after application).

Similar articles

Cited by

References

    1. Aguirre AA, Chittajallu R, Belachew S, Gallo V. NG2-expressing cells in the subventricular zone are type C-like cells and contribute to interneuron generation in the postnatal hippocampus. J Cell Biol. 2004;165:575–589. 10.1083/jcb.200311141. - DOI - PMC - PubMed
    1. Belachew S, Chittajallu R, Aguirre AA, Yuan X, Kirby M, Anderson S, Gallo V. Postnatal NG2 proteoglycan-expressing progenitor cells are intrinsically multipotent and generate functional neurons. J Cell Biol. 2003;161:169–186. 10.1083/jcb.200311141. - DOI - PMC - PubMed
    1. Benninger F, Beck H, Werning M, Tucker KL, Brustle O, Scheffler B. Functional integration of embryonic stem cell-derived neurons in hippocampal slice cultures. J Neurosci. 2003;23:7075–7083. - PMC - PubMed
    1. Bergles DE, Roberts JD, Somogyi P, Jahr CE. Glutamatergic synapses on oligodendrocyte precursor cells in the hippocampus. Nature. 2000;405:187–191. - PubMed
    1. Berry M, Hubbard P, Butt AM. Cytology and lineage of NG2-positive glia. J Neurocytol. 2002;31:457–467. - PubMed

Publication types

LinkOut - more resources