. 2004 Oct 1;23(19):3854-63.
doi: 10.1038/sj.emboj.7600365. Epub 2004 Sep 9.

Bystander gene activation by a locus control region

Affiliations

Bystander gene activation by a locus control region

Isabela Cajiao et al. EMBO J. .

Abstract

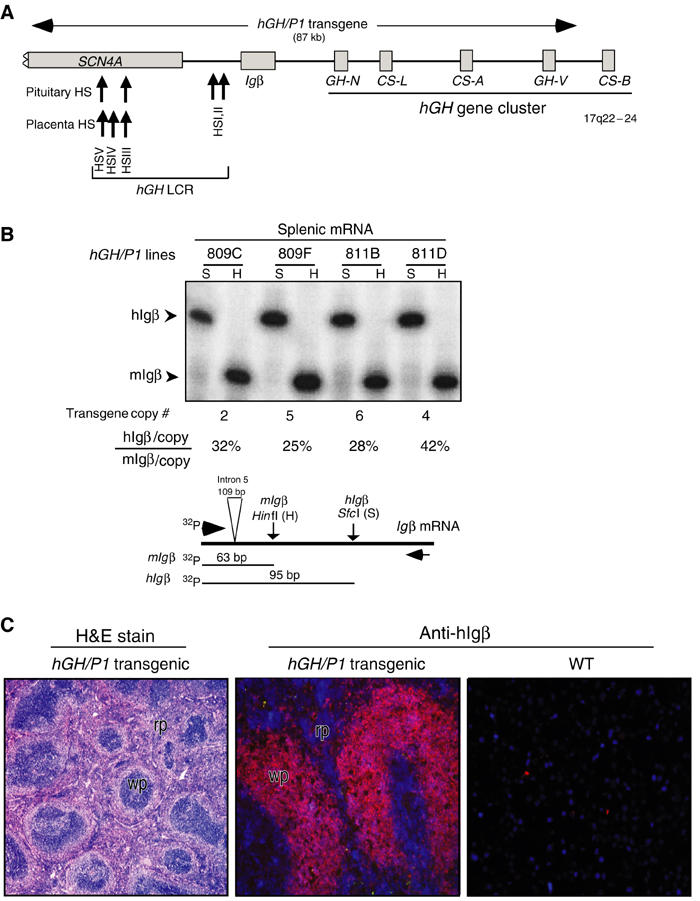
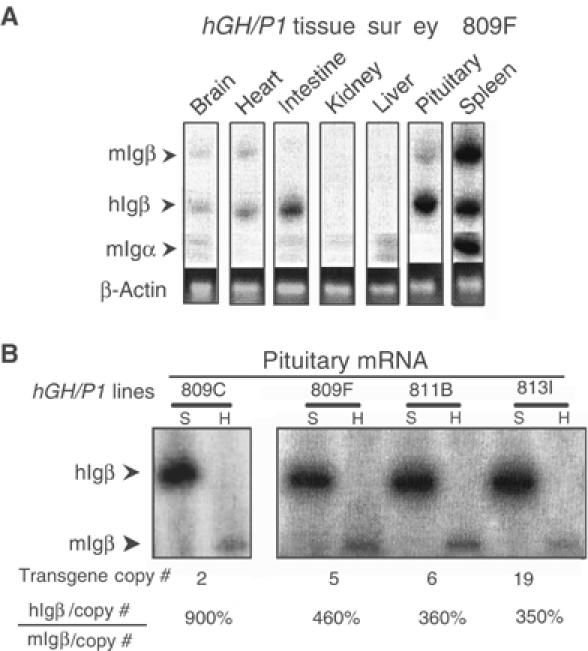
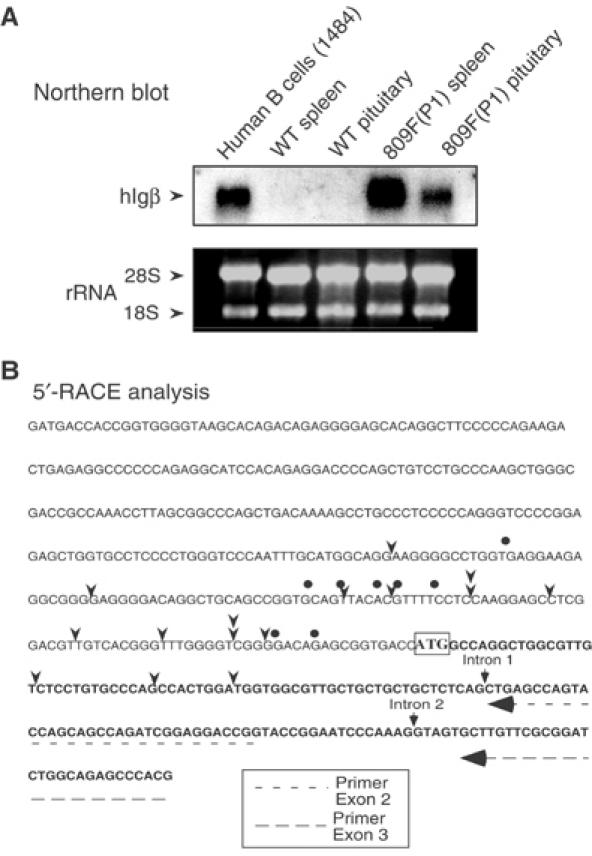
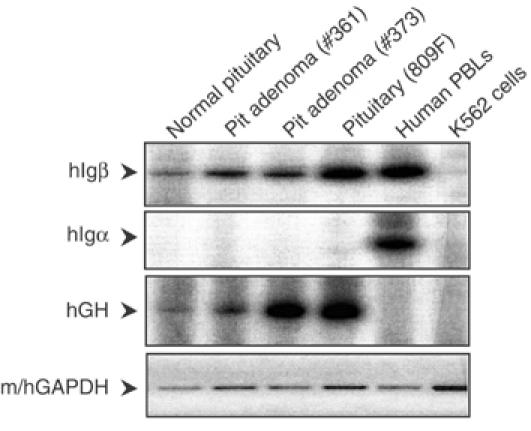
Random assortment of genes within mammalian genomes establishes the potential for interference between neighboring genes with distinct transcriptional specificities. Long-range transcriptional controls further increase this potential. Exploring this problem is of fundamental importance to understanding gene regulation. In the human genome, the Igbeta (CD79b) gene is situated between the pituitary-specific human growth hormone (hGH) gene and its locus control region (hGH LCR). Igbeta protein is considered B-cell specific; its only known role is in B-cell receptor signaling. Unexpectedly, we found that hIgbeta is transcribed at high levels in the pituitary. This Igbeta transcription is dependent on pituitary-specific epigenetic modifications generated by the hGH LCR. In contrast, expression of Igbeta at its native site in B cells is independent of hGH LCR activity. These studies demonstrated that a gene with tissue-restricted transcriptional determinants (B cell) can be robustly activated in an unrelated tissue (pituitary) due to fortuitous positioning within an active chromatin domain. This 'bystander' gene activation pathway impacts on current concepts of tissue specificity and models of active chromatin domains.


Figures

Figure 1
Figure 1
hIgβ expression in the spleens of hGH/P1 transgenic mice. (A) Map of the hIgβ/hGH locus and the hGH/P1 transgene. Each gene is represented by a labeled box. SCN4A, hIgβ, and the five genes in the hGH cluster are represented. The horizontal arrow above the locus indicates the hGH/P1 transgene. DNaseI HS of the hGH LCR are indicated by upward arrows along with their respective tissue specificities. (B) Splenic expression of hIgβ from the hGH/P1 transgene is copy number dependent. hIgβ mRNA and endogenous mIgβ mRNA were coamplified (RT/PCR) and the cDNAs were distinguished by restriction analysis. A representative RT/PCR analysis is presented in the autoradiograph and a diagram of the assay is shown below. The 5′ primer was 32P-end labeled and the PCR products were digested with HinfI (H) that exclusively digests the mIgβ PCR product and SfcI (S) that exclusively digests the hIgβ PCR product. The 5′-labeled fragments generated from mouse (63 bp) and human Igβ (95 bp) cDNAs are indicated (arrowheads). These signals were quantified from four unique hGH/P1 transgenic lines. The transgene copy number for each line is noted below each lane. Transgene expression per transgene copy was normalized to endogenous mIgβ and values are indicated as percentages below each respective lane. (C) hIgβ transgene is selectively expressed in the white pulp of the mouse spleen. (Left) Hematoxylin and eosin staining of an hGH/P1 transgenic spleen showing normal architecture of the spleen and indicating the defined areas of red pulp (rp) and white pulp (wp). (Middle) hGH/P1 transgenic spleen stained with anti-hIgβ (Texas red). The intense hIgβ staining is restricted to white pulp (wp) consistent with the local abundance of B lymphocytes. (Right) Nontransgenic, wild-type (WT) spleen stained with anti-hIgβ. The absence of a signal confirms the species specificity of the anti-hIgβ antibody.
Figure 2
Figure 2
Igβ is transcribed from the hGH/P1 transgene in the mouse pituitary. (A) Tissue survey of hGH/P1 transgenic mice revealed abundant hIgβ mRNA in the pituitary. A co-RT/PCR endonuclease cleavage assay was used to analyze the tissue specificity of hIgβ expression in a representative hGH/P1 transgenic mouse line (line 809F). The RT/PCR assay was identical to Figure 1B with the exception that the 3′ primer is 32P-end labeled. The figure shows the PCR products digested with SfcI; the larger band (336 bp) corresponds to mIgβ and the smaller (250 bp) to hIgβ (labeled arrows). A separate RT/PCR of mIgα mRNA was carried out to monitor B-lymphocyte contamination in each tissue. The levels of hIgβ, mIgβ, and mIgα are shown relative to a β-actin mRNA loading control (ethidium bromide-stained gel). (B) Pituitary expression of hIgβ mRNA from the hGH/P1 transgene was copy number dependent. Pituitaries from four hGH/P1 transgenic mouse lines were assayed by RT/PCR for hIgβ mRNA. The level of hIgβ mRNA was normalized to endogenous mouse pituitary Igβ mRNA and this value is shown as a percentage below each pair of lanes after correction for gene copy number.
Figure 3
Figure 3
Structural comparison of hIgβ mRNAs in the transgenic pituitary and B cells. (A) Northern blot analysis. Total RNAs from a human B-cell line (1484), from wild-type (WT) mouse lymphocytes (spleen) and pituitary, and lymphocytes (spleen) and pituitary of hGH/P1 transgenic mouse line 809F were hybridized with a [32P] labeled hIgβ cDNA probe. The gel was stained with ethidium bromide to visualize 18S and 28S rRNAs as loading control. The hIgβ mRNA hybridizing bands comigrated in all tissues. No additional bands were detected. The absence of signal in the lanes containing WT lymphocytes and pituitary RNA confirmed the species specificity of the hIgβ probe. (B) Mapping the 5′ terminus of pituitary and B-cell Igβ mRNAs. The sequence of the hIgβ 5′-flanking region and 5′-terminal transcribed region are shown; the translation start site, ATG, is boxed. The 5′ termini of the transcribed mRNAs in B cells and transgenic pituitary were determined by 5′ RACE. The arrowheads indicate transcription start sites of hIgβ in the hGH/P1 transgenic mouse pituitary mRNA population. The dots indicate the hIgβ start sites in human B-cell line 1484. The figure also indicates the locations of the primers used for the 5′-RACE assay (dashed arrows) and the positions of introns 1 and 2.
Figure 4
Figure 4
hIgβ mRNA is expressed in human pituitaries. (Top panel) A normal human pituitary and two human pituitary adenomas (#361 and #373) were evaluated for hIgβ mRNA by RT/PCR using 32P-labeled RT–PCR primers. Positive controls were human peripheral blood lymphocytes (PBLs), hGH/P1 transgenic pituitary (809F line), and the negative control was the human erythroid cell line K562. (Second panel) Igα was monitored by RT/PCR with labeled primers. (Third panel) hGH RT/PCR with labeled primers identified the human and transgenic mouse pituitaries. (Bottom panel) Detection of m/hGAPDH by RT–PCR represented the loading control (ethidium bromide-stained products). All RT/PCR reactions were assayed in the linear range of amplification.
Figure 5
Figure 5
hIgβ expression in the transgenic pituitary is dependent on the hGH LCR. (A) Transgene constructs. A map of the hGH gene cluster is shown. Horizontal arrows above the map indicate the extent of each transgene. The sizes of the constructs are indicated in parentheses and the designation of each construct indicates the extent of sequences 5′ from the hIgβ gene promoter. Note that hGH/P1 and −8.0Igβ transgenes include HSI whereas this determinant is excluded from the −0.2Igβ and −1.3Igβ transgenes. In hGH/P1(ΔHSI), a 99 bp segment (dashed box), corresponding to the critical core elements of HSI, has been deleted from the hGH/P1 transgene (Ho 2002). (B) HSI of the hGH LCR is a critical determinant of pituitary hIgβ expression. The ratios of pituitary hIgβ to mIgβ mRNAs in the series of hIgβ transgenic mouse lines (A) are shown. Mice from F1 or later generations and from at least three independent lines (dots) were analyzed (X-axis). The hIgβ to mIgβ mRNA ratios in each transgenic pituitary were plotted on the Y-axis as a percentage. The horizontal lines represent the mean values for each construct in the three or more lines analyzed. Representative co-RT/PCR endonuclease cleavage assays corresponding to each construct are shown below the graph. Wild-type mouse (WT) pituitary RNA was used as negative control. Expression ratios were corrected for transgene copy number.
Figure 6
Figure 6
Activation of hIgβ transcription by the hGH LCR is limited to the pituitary. (A) hGH-N mRNA is restricted to the pituitary. mGH and hGH mRNAs were detected by an RT/PCR endonuclease cleavage assay. This assay, shown below the autoradiograph, was applied to tissues from an hGH/P1 transgenic mouse. Arrows to the left of the autoradiograph (upper panel) indicate the expected positions of the mGH and hGH RT/PCR products. In the lower panel, β-actin PCR products in each lane are visualized by ethidium bromide staining. (B) hIgβ transgene expression in the spleen is not linked to HSI activity. Splenic RNA samples from three independent lines of mice carrying the hGH/P1ΔHSI construct (lines 960G, 961E, and 969E) were analyzed for hIgβ expression by the co-RT/PCR endonuclease cleavage assay (Figure 1B). The level of transgene expression per gene copy was determined. The percentage of hIgβ to endogenous mIgβ expression is indicated below the autoradiograph. (C) hIgβ is not expressed in the placenta. RNA samples from an hGH/P1 placenta (line 809C), a human term placenta, a transgenic pituitary, human PBLs, and an erythroid cell line (K562) were each analyzed for hIgβ expression by RT/PCR. Igα mRNA was assessed to detect potential B-cell contamination of the tissue samples. The lower panel visualizes the products of a β-actin RT/PCR assay by ethidium bromide staining shown as a loading control.
Figure 7
Figure 7
hIgβ protein does not accumulate in hIgβ transgenic mouse pituitaries. Protein extracts from −8.0Igβ and hGH/P1 transgenic pituitaries (lines 1047E and 811B, respectively), human B-cell line 1484, and a −8.0Igβ transgenic spleen (line 1047E) were studied by Western analysis. The top panel was incubated with an antibody to hIgβ and the bottom panel with an antibody to ribosomal protein L7a. Both panels were then developed with secondary antibodies and signals detected by enhanced chemiluminescence. The positions of hIgβ and the ribosomal protein L7 are indicated.

Similar articles

Cited by

References

    1. Akerblad P, Rosberg M, Leanderson T, Sigvardsson M (1999) The B29 (immunoglobulin beta-chain) gene is a genetic target for early B-cell factor. Mol Cell Biol 19: 392–401 - PMC - PubMed
    1. Asa SL, Puy LA, Lew AM, Sundmark VC, Elsholtz HP (1993) Cell type-specific expression of the pituitary transcription activator pit-1 in the human pituitary and pituitary adenomas. J Clin Endocr Metab 77: 1275–1280 - PubMed
    1. Ashe HL, Monks J, Wijgerde M, Fraser P, Proudfoot NJ (1997) Intergenic transcription and transinduction of the human beta-globin locus. Gene Dev 11: 2494–2509 - PMC - PubMed
    1. Barsh GS, Seeburg PH, Gelinas RE (1983) The human growth hormone gene family: structure and evolution of the chromosomal locus. Nucleic Acids Res 11: 3939–3958 - PMC - PubMed
    1. Bell AC, Felsenfeld G (1999) Stopped at the border: boundaries insulators. Curr Opin Genet Dev 9: 191–198 - PubMed

Publication types

MeSH terms