. 2004 Oct 1;23(19):3864-73.
doi: 10.1038/sj.emboj.7600393. Epub 2004 Sep 9.

Centrosome amplification induced by DNA damage occurs during a prolonged G2 phase and involves ATM

Affiliations

Centrosome amplification induced by DNA damage occurs during a prolonged G2 phase and involves ATM

Helen Dodson et al. EMBO J. .

Abstract

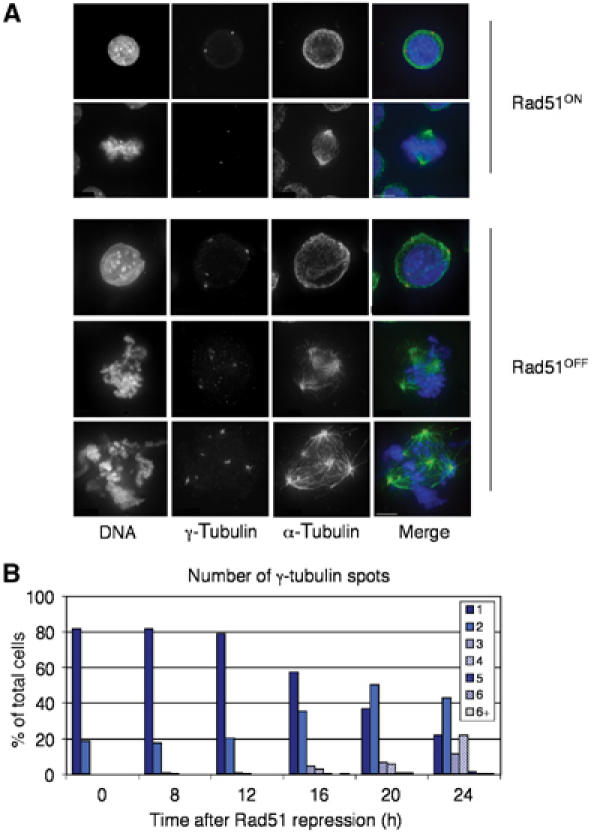
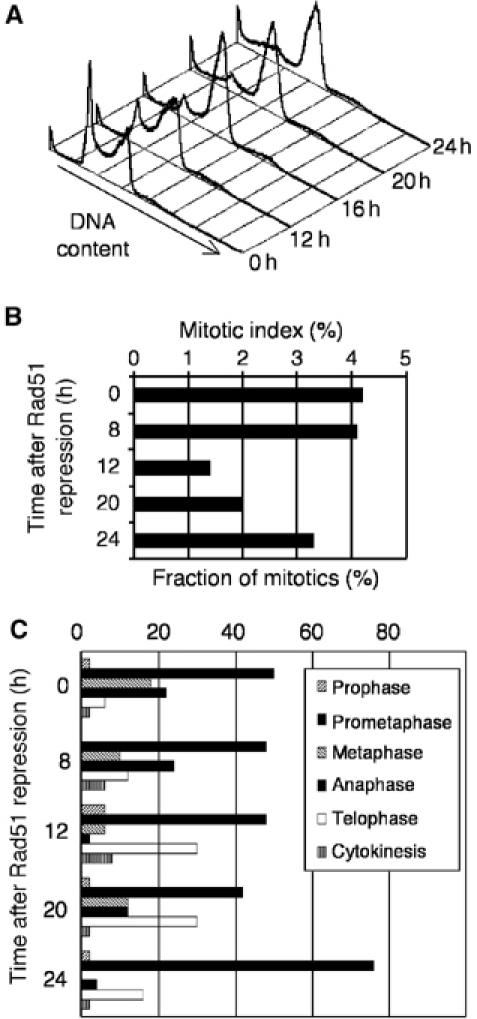
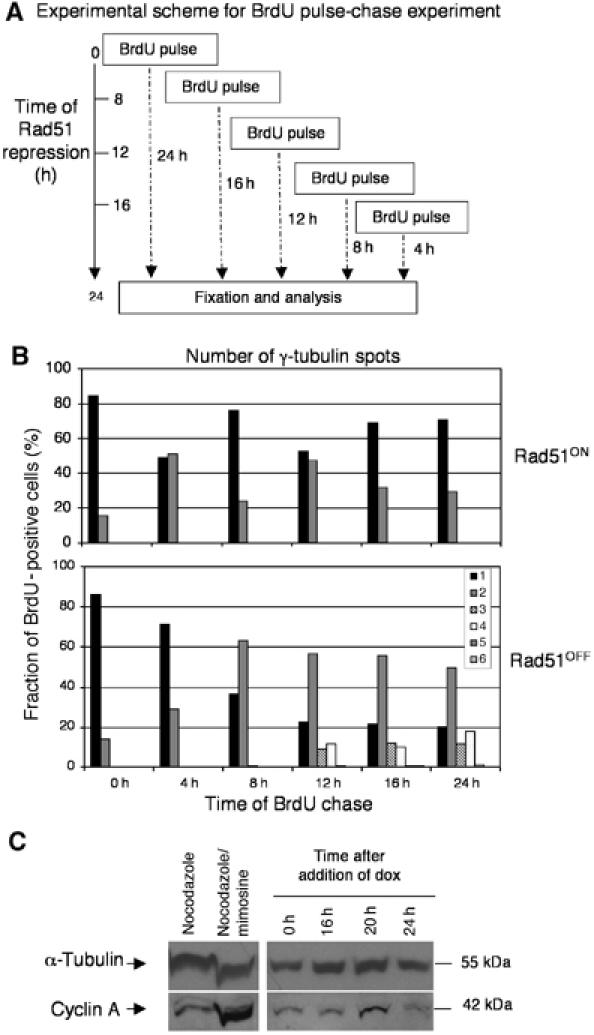
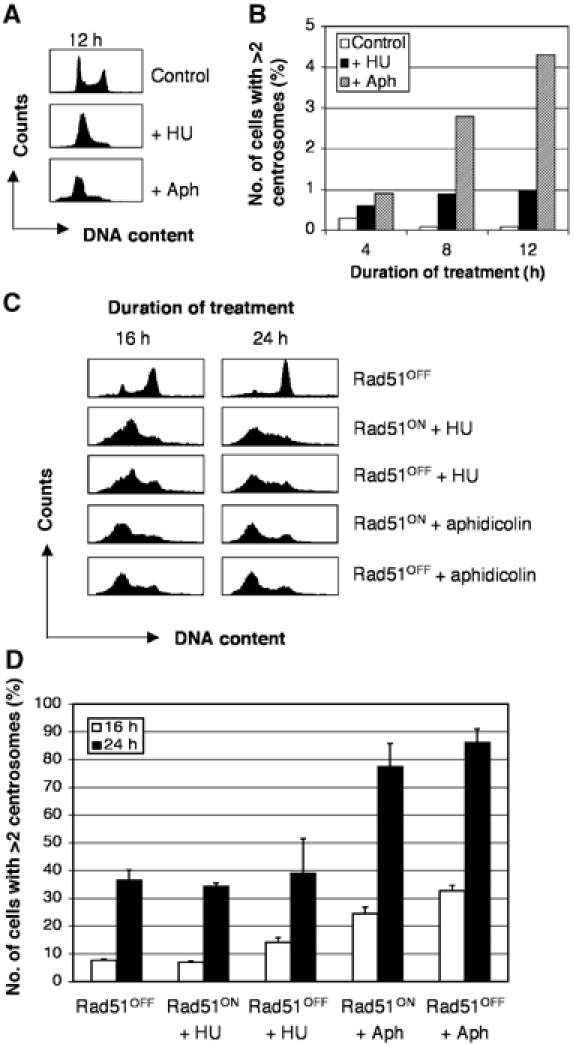
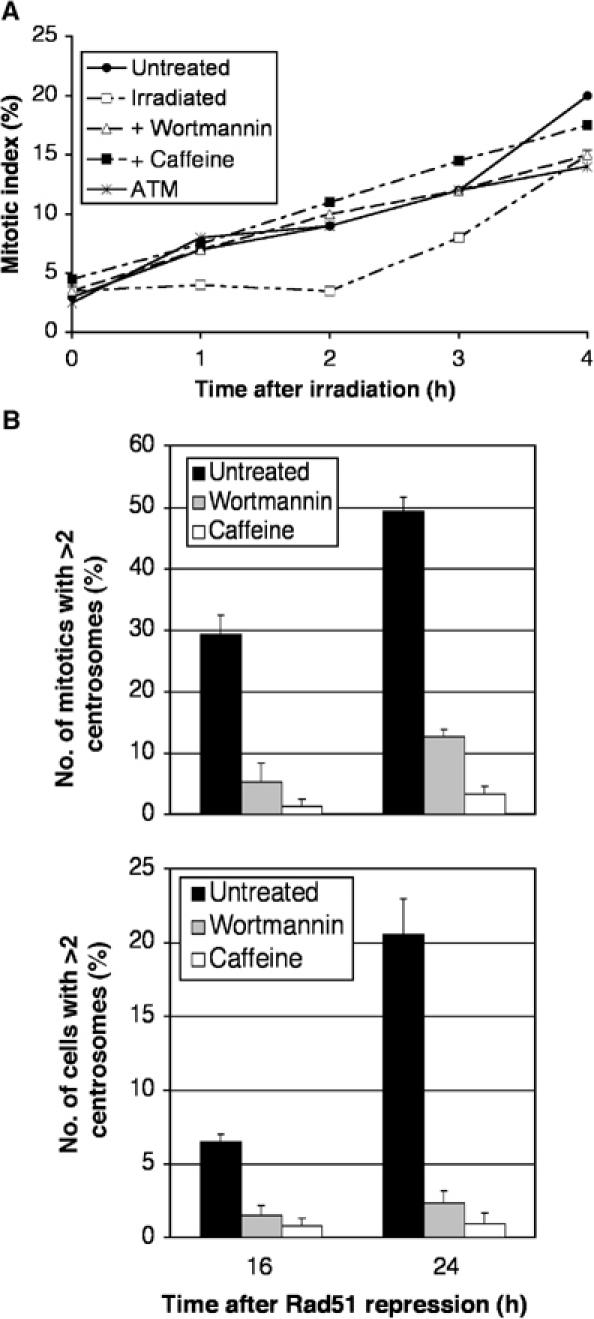
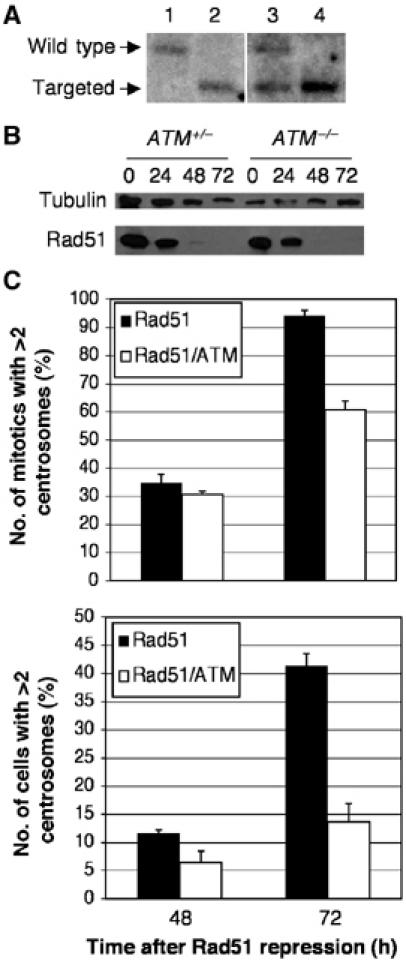
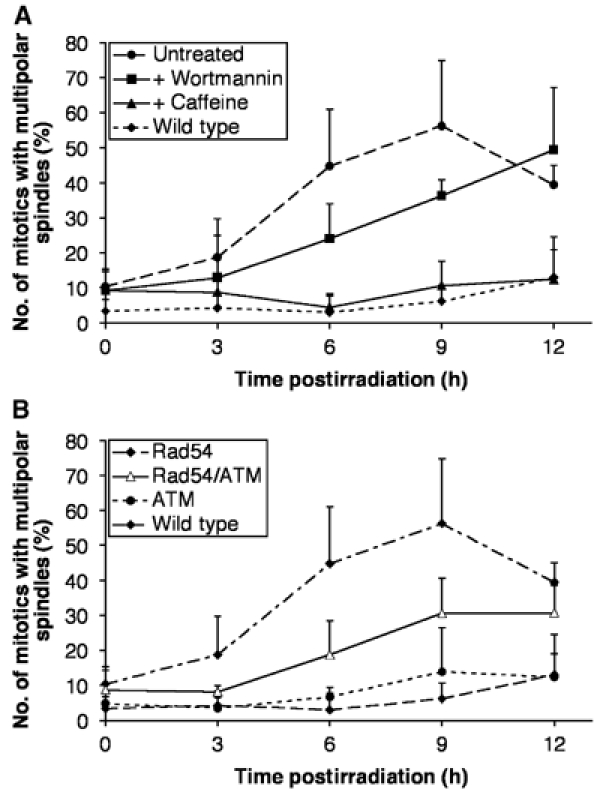
Centrosomes are the principal microtubule organising centres in somatic cells. Abnormal centrosome number is common in tumours and occurs after gamma-irradiation and in cells with mutations in DNA repair genes. To investigate how DNA damage causes centrosome amplification, we examined cells that conditionally lack the Rad51 recombinase and thereby incur high levels of spontaneous DNA damage. Rad51-deficient cells arrested in G2 phase and formed supernumerary functional centrosomes, as assessed by light and serial section electron microscopy. This centrosome amplification occurred without an additional DNA replication round and was not the result of cytokinesis failure. G2-to-M checkpoint over-ride by caffeine or wortmannin treatment strongly reduced DNA damage-induced centrosome amplification. Radiation-induced centrosome amplification was potentiated by Rad54 disruption. Gene targeting of ATM reduced, but did not abrogate, centrosome amplification induced by DNA damage in both the Rad51 and Rad54 knockout models, demonstrating ATM-dependent and -independent components of DNA damage-inducible G2-phase centrosome amplification. Our data suggest DNA damage-induced centrosome amplification as a mechanism for ensuring death of cells that evade the DNA damage or spindle assembly checkpoints.


Figures

Figure 1
Figure 1
Centrosome amplification in Rad51-deficient cells. (A) Immunofluorescence microscopy of DT40 Rad51−/− cells before (Rad51ON) and after 24 h of doxycycline treatment (10 ng/ml) (Rad51OFF). Cells are stained for γ-tubulin (red), α-tubulin (green), and counterstained with DAPI (blue). Images are quick projections of Z (multiple focal planes) sections captured using the Deltavision deconvolution microscope. Scale bar, 5 μm. (B) Quantitation of supernumerary centrosomes. The number of γ-tubulin spots was counted at each of the time points shown after the addition of doxycycline. A total of 200 cells were counted at each time point.
Figure 2
Figure 2
Entry into aberrant mitosis by Rad51-deficient cells with multiple centrosomes. (A) FACS analysis of DNA content of Rad51OFF cells at the times indicated at right after Rad51 repression. Note the accumulation in G2/M phase and the increase in dead cells without any increase in a >2N population. (B) The mitotic index of Rad51OFF cells, determined at various times after Rad51 repression. Data from at least 50 mitotic cells are shown per data point. (C) Distribution of Rad51OFF cells in mitotic phases at various times indicated after Rad51 repression, as judged by BubR1 staining (Supplementary Figure S1) and spindle staining.
Figure 3
Figure 3
Supernumerary centrosomes in Rad51OFF cells contain multiple centrioles. Electron microscopy was performed on (A) control or (B) Rad51OFF cells 24 h after the addition of doxycycline (10 ng/ml). Cells were processed for immunofluorescence microscopy of α-tubulin (green) and staining of the DNA (blue). These cells were then flat embedded, and ultrathin serial sections were cut. At each pole in both the Rad51ON and Rad51OFF cells, two centrioles can be seen. Numbers on each colour image indicate the positions of the centrioles shown in the corresponding electron micrographs. Scale bar, 0.5 μm.
Figure 4
Figure 4
G2 arrest and centrosome duplication in Rad51OFF cells. (A) Experimental scheme of BrdU pulse-chase experiment. Rad51OFF cells were treated with a 15 min pulse of BrdU (20 μm), after which time they were washed three times in fresh medium and recultured in the presence or absence of doxycycline (10 ng/ml). Cells were all analysed at the same final time postrepression of 24 h. (B) Analysis of BrdU pulse-chase experiment. The number of centrosomes was counted in 200 BrdU-positive cells per data point; top, control cells (Rad51ON); bottom, Rad51OFF cells after Rad51 repression for the times indicated. A total of 200 cells were counted at each time point. The percentage of the total cells determined as BrdU positive by FACS analysis over the repression time course shown was 67% (8 h after Rad51 repression), 62% (12 h), 39% (16 h), 34% (20 h) and 22% (24 h). (C) Immunoblot analysis of cyclin A levels in mitotically arrested (nocodazole treated), early S phase (nocodazole/mimosine arrested; Sonoda et al, 2001) wild-type DT40 cells and from cells where the RAD51 transgene was repressed with doxycycline for 0, 16, 20 or 24 h as indicated. Immunoblot for α-tubulin was used as a loading control.
Figure 5
Figure 5
Centrosome amplification in Rad51OFF cells during extended S phase. (A) FACS profiles of wild-type DT40 cells treated as indicated. Aph, aphidicolin. (B) Histogram showing quantitation of cells with multiple centrosomes by immunofluorescence microscopy of γ-tubulin spots in 1000 cells per sample. (C) FACS analysis of the DNA content of Rad51-deficient or control cells after treatment with HU or aphidicolin as indicated. Sub-G1 cells have been gated from the analysis. (D) Histogram showing quantitation of cells with multiple centrosomes as for (A) in Rad51-deficient or control cells after treatment with HU or aphidicolin as indicated for the times shown in the key. Data shown are the mean+standard deviation of results from three separate experiments, each counting 1000 cells.
Figure 6
Figure 6
Suppression of centrosome amplification in Rad51OFF cells by G2-to-M checkpoint over-ride. (A) Cumulative mitotic indices of Rad51ON cells grown in the presence of colcemid for the times indicated after no treatment or after 1 Gy γ-irradiation, with or without preincubation with 1 μM wortmannin or 2 mM caffeine, as shown. A total of 200 cells were counted per time point. Similar results were obtained with wild-type DT40 cells in parallel experiments (data not shown). (B) Quantitation of cells with multiple centrosomes in the mitotic (upper) or entire cell population (lower) after the indicated length of time of Rad51 repression in the presence or absence of caffeine or wortmannin, as indicated. Centrosomes were counted by immunofluorescence microscopy of γ-tubulin spots. Data were obtained from 50 mitotic cells per experiment and histograms show the mean+standard deviation of results from three separate experiments, performed blind. Mean mitotic indices were not affected by the drug treatments and ranged from 2.76 to 3.04% over the entire experimental series shown.
Figure 7
Figure 7
Suppression of centrosome amplification in Rad51OFF cells by ATM disruption. (A) Southern blot analysis of the ATM locus in (1) wild-type, (2) ATM−/−, (3) Clone #104 Rad51−/−/ATM+/− and (4) Clone #104 Rad51−/−/ATM−/− DT40 cells. (B) Immunoblot analysis of Rad51 repression kinetics in the Clone #104-derived Rad51−/−/ATM+/− and Rad51−/−/ATM−/− DT40 cells used for centrosome analysis below. Cells were treated with doxycycline for the times indicated prior to harvest. Immunoblot for α-tubulin was used as a loading control. (C) Quantitation of cells with multiple centrosomes in the mitotic (upper) or entire cell population (lower) of the indicated genotypes after the indicated length of time of Rad51 repression. Quantitation and histogram data are as for Figure 6B.
Figure 8
Figure 8
Suppression by G2-to-M checkpoint disruption of centrosome amplification in irradiated DNA repair mutant cells. Data points show the mean+standard deviation of results from three separate experiments in which at least 30 mitotic cells were counted. (A) Quantitation of the mitotic Rad54-deficient and wild-type DT40 cells with multiple spindle poles at the times indicated after 2 Gy γ-irradiation. Where shown, cells were treated with 1 μM wortmannin or 2 mM caffeine 1 h prior to irradiation. (B) Quantitation of the mitotic ATM−/−, Rad54−/− and Rad54−/−/ATM−/− DT40 cells with multiple spindle poles at the times indicated after 2 Gy γ-irradiation. Data from wild-type cells are as shown in (A) for comparison.

Similar articles

Cited by

References

    1. Abraham RT (2001) Cell cycle checkpoint signaling through the ATM and ATR kinases. Genes Dev 15: 2177–2196 - PubMed
    1. Andreassen PR, Lohez OD, Lacroix FB, Margolis RL (2001) Tetraploid state induces p53-dependent arrest of nontransformed mammalian cells in G1. Mol Biol Cell 12: 1315–1328 - PMC - PubMed
    1. Balczon R, Bao L, Zimmer WE, Brown K, Zinkowski RP, Brinkley BR (1995) Dissociation of centrosome replication events from cycles of DNA synthesis and mitotic division in hydroxyurea-arrested Chinese hamster ovary cells. J Cell Biol 130: 105–115 - PMC - PubMed
    1. Bertrand P, Lambert S, Joubert C, Lopez BS (2003) Overexpression of mammalian Rad51 does not stimulate tumorigenesis while a dominant-negative Rad51 affects centrosome fragmentation, ploidy and stimulates tumorigenesis, in p53-defective CHO cells. Oncogene 22: 7587–7592 - PubMed
    1. Bezzubova O, Silbergleit A, Yamaguchi-Iwai Y, Takeda S, Buerstedde JM (1997) Reduced X-ray resistance and homologous recombination frequencies in a RAD54−/− mutant of the chicken DT40 cell line. Cell 89: 185–193 - PubMed

Publication types

MeSH terms

Substances