

Delayed hepcidin response explains the lag period in iron absorption following a stimulus to increase erythropoiesis
- PMID: 15361505
- PMCID: PMC1774251
- DOI: 10.1136/gut.2003.037416
Delayed hepcidin response explains the lag period in iron absorption following a stimulus to increase erythropoiesis
Abstract
Introduction: The delay of several days between an erythropoietic stimulus and the subsequent increase in intestinal iron absorption is commonly believed to represent the time required for body signals to programme the immature crypt enterocytes and for these cells to migrate to the villus. Recent data however suggest that signals from the body to alter absorption are mediated by circulating hepcidin and that this peptide exerts its effect on mature villus enterocytes.
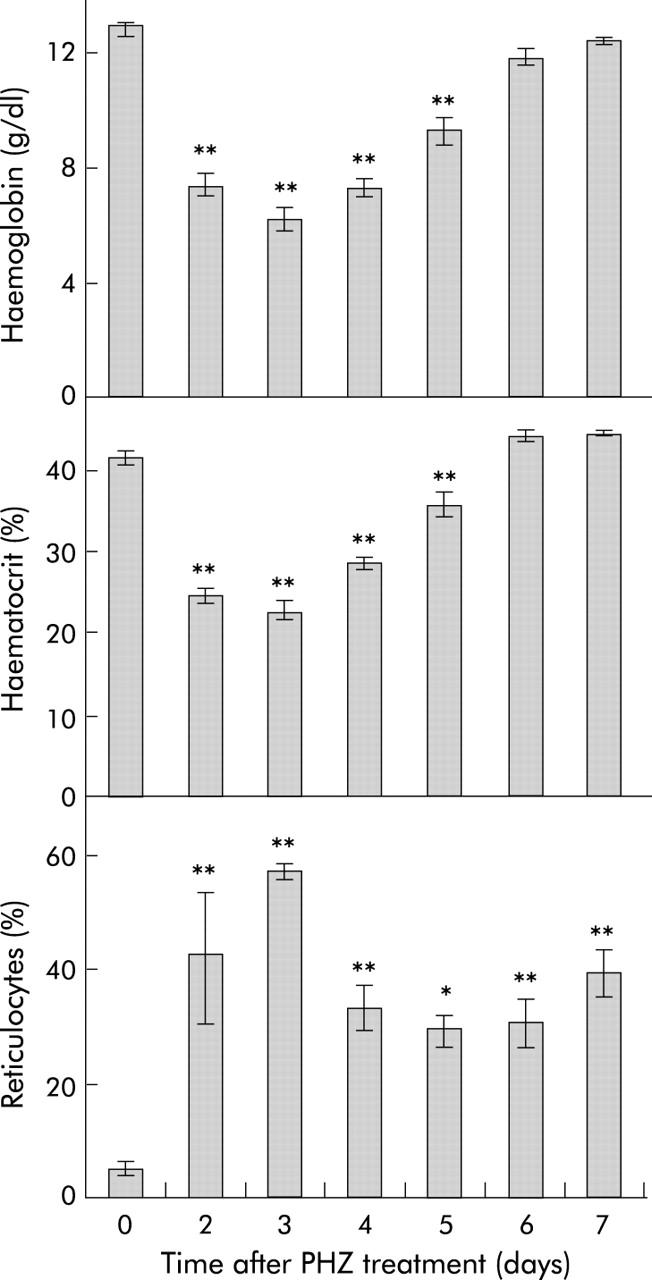
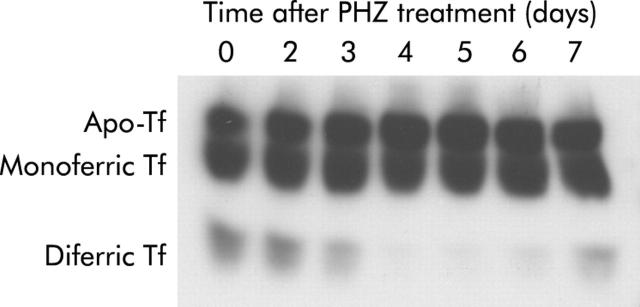
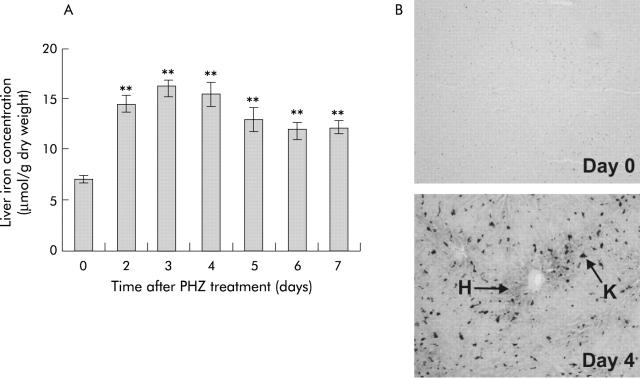
Methods: We have examined the delay in the absorptive response following stimulated erythropoiesis using phenylhydrazine induced haemolysis and correlated this with expression of hepcidin in the liver and iron transporters in the duodenum.
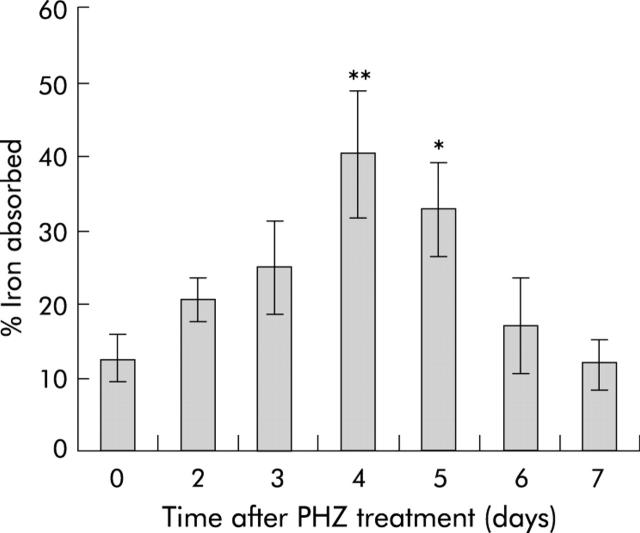
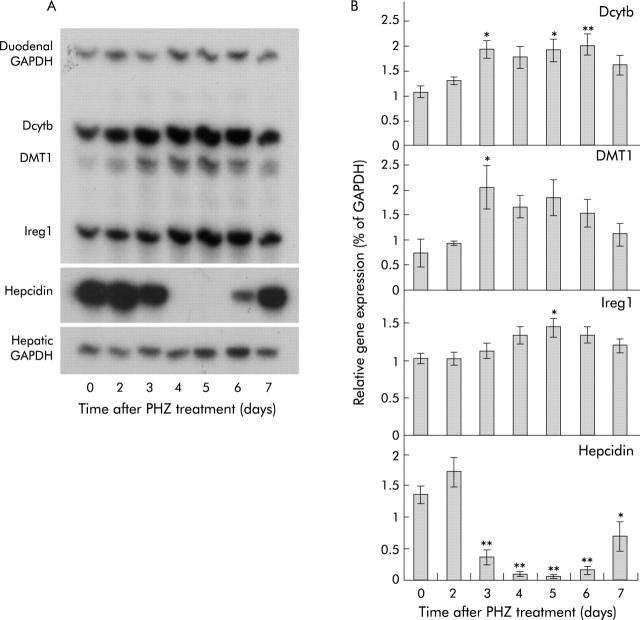
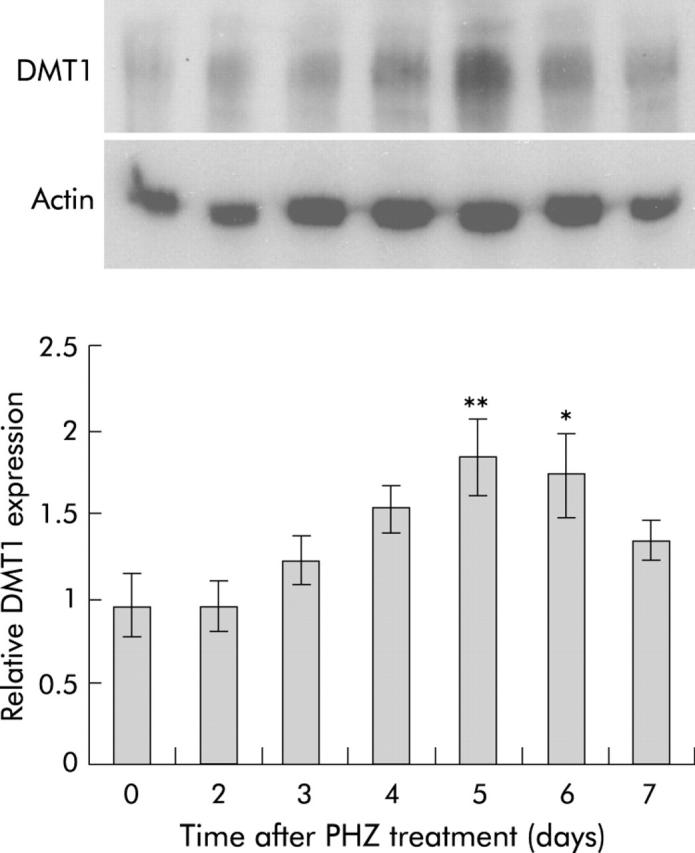
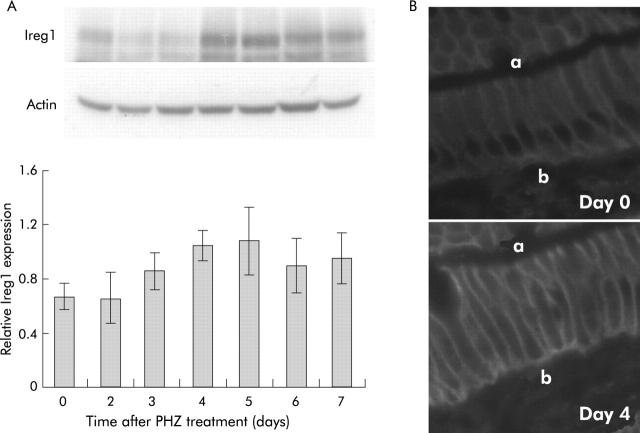
Results: There was a delay of four days following haemolysis before a significant increase in iron absorption was observed. Hepatic hepcidin expression did not decrease until day 3, reaching almost undetectable levels by days 4 and 5. This coincided with the increase in duodenal expression of divalent metal transporter 1, duodenal cytochrome b, and Ireg1.
Conclusion: These results suggest that the delayed increase in iron absorption following stimulated erythropoiesis is attributable to a lag in the hepcidin response rather than crypt programming, and are consistent with a direct effect of the hepcidin pathway on mature villus enterocytes.
Figures
Similar articles
-
Hepcidin expression inversely correlates with the expression of duodenal iron transporters and iron absorption in rats.Gastroenterology. 2002 Sep;123(3):835-44. doi: 10.1053/gast.2002.35353. Gastroenterology. 2002. PMID: 12198710
-
Relationship between intestinal iron-transporter expression, hepatic hepcidin levels and the control of iron absorption.Biochem Soc Trans. 2002 Aug;30(4):724-6. doi: 10.1042/bst0300724. Biochem Soc Trans. 2002. PMID: 12196177
-
Hepcidin mRNA levels in mouse liver respond to inhibition of erythropoiesis.Physiol Res. 2006;55(6):667-674. doi: 10.33549/physiolres.930841. Physiol Res. 2006. PMID: 16497104
-
The relevance of the intestinal crypt and enterocyte in regulating iron absorption.Pflugers Arch. 2007 Nov;455(2):201-13. doi: 10.1007/s00424-007-0264-9. Epub 2007 May 1. Pflugers Arch. 2007. PMID: 17473933 Review.
-
Animal models with enhanced erythropoiesis and iron absorption.Biochim Biophys Acta. 2006 Apr;1762(4):414-23. doi: 10.1016/j.bbadis.2005.12.007. Epub 2006 Jan 11. Biochim Biophys Acta. 2006. PMID: 16459059 Review.
Cited by
-
Expression of hepcidin mRNA is uniformly suppressed in hepatocellular carcinoma.BMC Cancer. 2008 Jun 9;8:167. doi: 10.1186/1471-2407-8-167. BMC Cancer. 2008. PMID: 18541040 Free PMC article.
-
The hypoxia-inducible factor-C/EBPα axis controls ethanol-mediated hepcidin repression.Mol Cell Biol. 2012 Oct;32(19):4068-77. doi: 10.1128/MCB.00723-12. Epub 2012 Aug 6. Mol Cell Biol. 2012. PMID: 22869521 Free PMC article.
-
In silico QTL mapping of basal liver iron levels in inbred mouse strains.Physiol Genomics. 2011 Feb 11;43(3):136-47. doi: 10.1152/physiolgenomics.00025.2010. Epub 2010 Nov 9. Physiol Genomics. 2011. PMID: 21062905 Free PMC article.
-
Hypoxia inhibits hepcidin expression in HuH7 hepatoma cells via decreased SMAD4 signaling.Am J Physiol Cell Physiol. 2011 Apr;300(4):C888-95. doi: 10.1152/ajpcell.00121.2010. Epub 2011 Feb 2. Am J Physiol Cell Physiol. 2011. PMID: 21289291 Free PMC article.
-
Liver-gut axis in the regulation of iron homeostasis.World J Gastroenterol. 2007 Sep 21;13(35):4737-45. doi: 10.3748/wjg.v13.i35.4737. World J Gastroenterol. 2007. PMID: 17729395 Free PMC article. Review.
References
Publication types
MeSH terms
Substances
Grants and funding
LinkOut - more resources
Full Text Sources
Medical