

Pattern of sequence variation across 213 environmental response genes
- PMID: 15364900
- PMCID: PMC524406
- DOI: 10.1101/gr.2730004
Pattern of sequence variation across 213 environmental response genes
Abstract
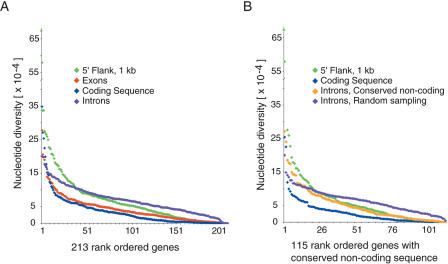
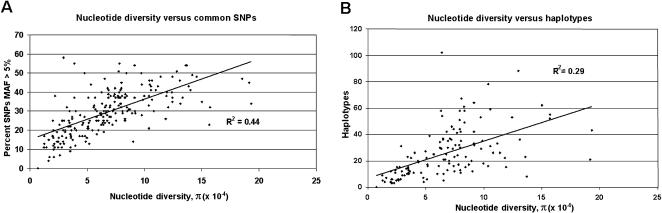
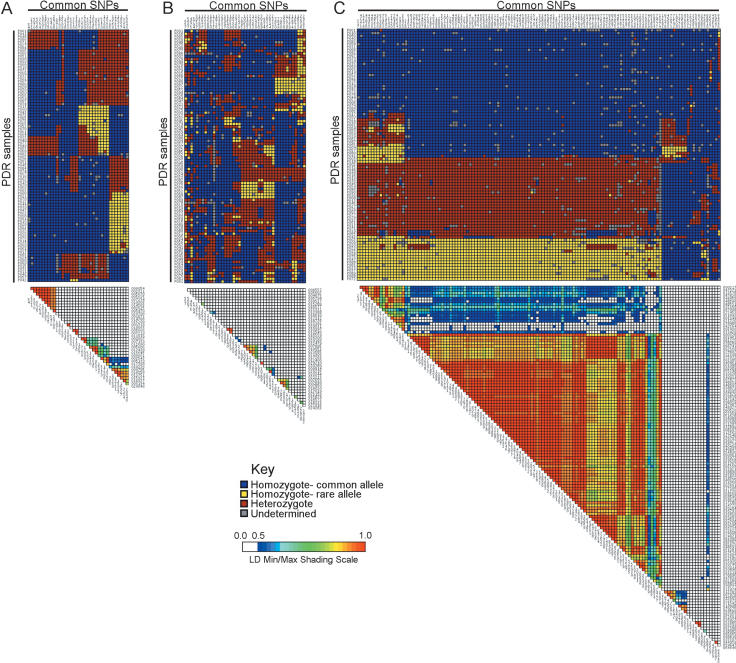
To promote the clinical and epidemiological studies that improve our understanding of human genetic susceptibility to environmental exposure, the Environmental Genome Project (EGP) has scanned 213 environmental response genes involved in DNA repair, cell cycle regulation, apoptosis, and metabolism for single nucleotide polymorphisms (SNPs). Many of these genes have been implicated by loss-of-function mutations associated with severe diseases attributable to decreased protection of genomic integrity. Therefore, the hypothesis for these studies is that individuals with functionally significant polymorphisms within these genes may be particularly susceptible to genotoxic environmental agents. On average, 20.4 kb of baseline genomic sequence or 86% of each gene, including a substantial amount of introns, all exons, and 1.3 kb upstream and downstream, were scanned for variations in the 90 samples of the Polymorphism Discovery Resource panel. The average nucleotide diversity across the 4.2 MB of these 213 genes is 6.7 x 10(-4), or one SNP every 1500 bp, when two random chromosomes are compared. The average candidate environmental response gene contains 26 PHASE inferred haplotypes, 34 common SNPs, 6.2 coding SNPs (cSNPs), and 2.5 nonsynonymous cSNPs. SIFT and Polyphen analysis of 541 nonsynonymous cSNPs identified 57 potentially deleterious SNPs. An additional eight polymorphisms predict altered protein translation. Because these genes represent 1% of all known human genes, extrapolation from these data predicts the total genomic set of cSNPs, nonsynonymous cSNPs, and potentially deleterious nonsynonymous cSNPs. The implications for the use of these data in direct and indirect association studies of environmentally induced diseases are discussed.
Figures
Similar articles
-
Identification and characterization of coding single-nucleotide polymorphisms within human protocadherin-alpha and -beta gene clusters.Gene. 2005 Apr 11;349:1-14. doi: 10.1016/j.gene.2004.11.044. Gene. 2005. PMID: 15777644
-
Large-scale identification and characterization of genetic variants in asthma candidate genes.Immunogenetics. 2005 Oct;57(9):636-43. doi: 10.1007/s00251-005-0024-y. Epub 2005 Oct 18. Immunogenetics. 2005. PMID: 16189670
-
Patterns of single-nucleotide polymorphisms in candidate genes for blood-pressure homeostasis.Nat Genet. 1999 Jul;22(3):239-47. doi: 10.1038/10297. Nat Genet. 1999. PMID: 10391210
-
Single nucleotide polymorphism in transcriptional regulatory regions and expression of environmentally responsive genes.Toxicol Appl Pharmacol. 2005 Sep 1;207(2 Suppl):84-90. doi: 10.1016/j.taap.2004.09.024. Toxicol Appl Pharmacol. 2005. PMID: 16002116 Review.
-
Computational prediction of the effects of non-synonymous single nucleotide polymorphisms in human DNA repair genes.Neuroscience. 2007 Apr 14;145(4):1273-9. doi: 10.1016/j.neuroscience.2006.09.004. Epub 2006 Oct 19. Neuroscience. 2007. PMID: 17055652 Review.
Cited by
-
Assessment of Peripheral Blood Lymphocytes in Parents of Autistic Children by Cytokinesis Block Micronucleus Assay.Neuromolecular Med. 2021 Dec;23(4):466-470. doi: 10.1007/s12017-021-08652-4. Epub 2021 Mar 22. Neuromolecular Med. 2021. PMID: 33751343
-
Inference and analysis of haplotypes from combined genotyping studies deposited in dbSNP.Genome Res. 2005 Nov;15(11):1594-600. doi: 10.1101/gr.4297805. Genome Res. 2005. PMID: 16251470 Free PMC article.
-
Sex-biased evolutionary forces shape genomic patterns of human diversity.PLoS Genet. 2008 Sep 26;4(9):e1000202. doi: 10.1371/journal.pgen.1000202. PLoS Genet. 2008. PMID: 18818765 Free PMC article.
-
Estimates of natural selection due to protein tertiary structure inform the ancestry of biallelic loci.Gene. 2009 Jul 15;441(1-2):45-52. doi: 10.1016/j.gene.2008.07.020. Epub 2008 Jul 29. Gene. 2009. PMID: 18725272 Free PMC article.
-
Evidence for pervasive adaptive protein evolution in wild mice.PLoS Genet. 2010 Jan 22;6(1):e1000825. doi: 10.1371/journal.pgen.1000825. PLoS Genet. 2010. PMID: 20107605 Free PMC article.
References
-
- Alonso, J., Garcia-Miguel, P., Abelairas, J., Mendiola, M., Sarret, E., Vendrell, M.T., Navajas, A., and Pestana, A. 2001. Spectrum of germline RB1 gene mutations in Spanish retinoblastoma patients: Phenotypic and molecular epidemiological implications. Hum. Mutat. 17: 412-422. - PubMed
-
- Altshuler, D., Hirschhorn, J.N., Klannemark, M., Lindgren, C.M., Vohl, M.C., Nemesh, J., Lane, C.R., Schaffner, S.F., Bolk, S., Brewer, C., et al. 2000. The common PPARγ Pro12Ala polymorphism is associated with decreased risk of type 2 diabetes. Nat. Genet. 26: 76-80. - PubMed
-
- Barth, M.L., Fensom, A., and Harris, A. 1995. Identification of seven novel mutations associated with metachromatic leukodystrophy. Hum. Mutat. 6: 170-176. - PubMed
WEB SITE REFERENCES
-
- http://locus.umdnj.edu/nigms/products/pdr.html); Coriell Institute.
-
- http://www.niehs.nih.gov/envgenom/home.htm; Environmental Genome Project.
-
- http://www.genome.utah.edu/genesnps; GeneSNPs.
-
- http://www.genomatix.de; Genomatix.
-
- http://www.ncbi.nlm.nih.gov/LocusLink; NCBI LocusLink.
Publication types
MeSH terms
Grants and funding
LinkOut - more resources
Full Text Sources
Other Literature Sources
Research Materials
Miscellaneous