

Organization and evolution of a gene-rich region of the mouse genome: a 12.7-Mb region deleted in the Del(13)Svea36H mouse
- PMID: 15364904
- PMCID: PMC524412
- DOI: 10.1101/gr.2478604
Organization and evolution of a gene-rich region of the mouse genome: a 12.7-Mb region deleted in the Del(13)Svea36H mouse
Abstract
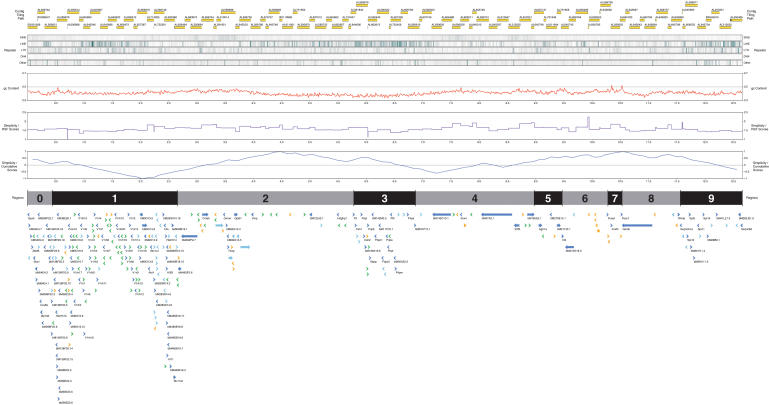
Del(13)Svea36H (Del36H) is a deletion of approximately 20% of mouse chromosome 13 showing conserved synteny with human chromosome 6p22.1-6p22.3/6p25. The human region is lost in some deletion syndromes and is the site of several disease loci. Heterozygous Del36H mice show numerous phenotypes and may model aspects of human genetic disease. We describe 12.7 Mb of finished, annotated sequence from Del36H. Del36H has a higher gene density than the draft mouse genome, reflecting high local densities of three gene families (vomeronasal receptors, serpins, and prolactins) which are greatly expanded relative to human. Transposable elements are concentrated near these gene families. We therefore suggest that their neighborhoods are gene factories, regions of frequent recombination in which gene duplication is more frequent. The gene families show different proportions of pseudogenes, likely reflecting different strengths of purifying selection and/or gene conversion. They are also associated with relatively low simple sequence concentrations, which vary across the region with a periodicity of approximately 5 Mb. Del36H contains numerous evolutionarily conserved regions (ECRs). Many lie in noncoding regions, are detectable in species as distant as Ciona intestinalis, and therefore are candidate regulatory sequences. This analysis will facilitate functional genomic analysis of Del36H and provides insights into mouse genome evolution.
Figures


Similar articles
-
The 1.4-Mb CMT1A duplication/HNPP deletion genomic region reveals unique genome architectural features and provides insights into the recent evolution of new genes.Genome Res. 2001 Jun;11(6):1018-33. doi: 10.1101/gr.180401. Genome Res. 2001. PMID: 11381029 Free PMC article.
-
Conserved synteny between the Ciona genome and human paralogons identifies large duplication events in the molecular evolution of the insulin-relaxin gene family.Mol Biol Evol. 2006 Jan;23(1):10-22. doi: 10.1093/molbev/msj002. Epub 2005 Aug 31. Mol Biol Evol. 2006. PMID: 16135778
-
Dynamic evolution of V1R putative pheromone receptors between Mus musculus and Mus spretus.BMC Genomics. 2009 Feb 9;10:74. doi: 10.1186/1471-2164-10-74. BMC Genomics. 2009. PMID: 19203383 Free PMC article.
-
The birth-and-death evolution of multigene families revisited.Genome Dyn. 2012;7:170-96. doi: 10.1159/000337119. Epub 2012 Jun 25. Genome Dyn. 2012. PMID: 22759819 Review.
-
Genome duplication and gene-family evolution: the case of three OXPHOS gene families.Gene. 2008 Sep 15;421(1-2):1-6. doi: 10.1016/j.gene.2008.05.011. Epub 2008 Jun 23. Gene. 2008. PMID: 18573316 Review.
Cited by
-
Bridging sequence diversity and tissue-specific expression by DNA methylation in genes of the mouse prolactin superfamily.Mamm Genome. 2012 Jun;23(5-6):336-45. doi: 10.1007/s00335-011-9383-x. Epub 2011 Dec 23. Mamm Genome. 2012. PMID: 22193412 Free PMC article.
-
The Influence of the Prolactins on the Development of the Uterus in Neonatal Mice.Front Vet Sci. 2022 Feb 17;9:818827. doi: 10.3389/fvets.2022.818827. eCollection 2022. Front Vet Sci. 2022. PMID: 35252420 Free PMC article.
-
Hypoxia and Placental Development.Birth Defects Res. 2017 Oct 16;109(17):1309-1329. doi: 10.1002/bdr2.1135. Birth Defects Res. 2017. PMID: 29105383 Free PMC article. Review.
-
The rat prolactin gene family locus: species-specific gene family expansion.Mamm Genome. 2006 Aug;17(8):858-77. doi: 10.1007/s00335-006-0010-1. Epub 2006 Aug 4. Mamm Genome. 2006. PMID: 16897344
-
Cryptic speciation in a model invertebrate chordate.Proc Natl Acad Sci U S A. 2007 May 29;104(22):9364-9. doi: 10.1073/pnas.0610158104. Epub 2007 May 21. Proc Natl Acad Sci U S A. 2007. PMID: 17517633 Free PMC article.
References
-
- Alba, M.M., Laskowski, R.A., and Hancock, J.M. 2002. Detecting cryptically simple protein sequences using the SIMPLE algorithm. Bioinformatics 18: 672-678. - PubMed
-
- Albig, W. and Doenecke, D. 1997. The human histone gene cluster at the D6S105 locus Hum. Genet. 101: 284-294. - PubMed
-
- Altschul, S.F., Gish, W., Miller, W., Myers, E.W., and Lipman, D.J. 1990. Basic local alignment search tool. J. Mol. Biol. 215: 403-410. - PubMed
-
- Arkell, R.M., Cadman, M., Marsland, T., Southwell, A., Thaung, C., Davies, J.R., Clay, T., Beechey, C.V., Evans, E.P., Strivens, M.A., et al. 2001. Genetic, physical, and phenotypic characterization of the Del(13)Svea36H mouse. Mamm. Genome 12: 687-694. - PubMed
WEB SITE REFERENCES
-
- http://vega.sanger.ac.uk/Mus_musculus/; Vega Mouse Genome Browser.
-
- http://bioinfo2.ugr.es/isochores/; Online Resource on Isochore Mapping.
-
- http://www.hgmp.mrc.ac.uk/Registered/Webapp/blast/; MRC Rosalind Franklin Centre BLAST interface.
-
- http://www.bcgsc.ca/lab/mapping/mouse; Michael Smith Genome Sciences Centre Mouse Mapping.
-
- http://blast.wustl.edu; Washington University BLAST archives.
Publication types
MeSH terms
Grants and funding
LinkOut - more resources
Full Text Sources
Molecular Biology Databases
Miscellaneous