. 2004 Sep 13;166(6):839-51.
doi: 10.1083/jcb.200404158.

Mathematical modeling reveals threshold mechanism in CD95-induced apoptosis

Affiliations

Mathematical modeling reveals threshold mechanism in CD95-induced apoptosis

M Bentele et al. J Cell Biol. .

Abstract

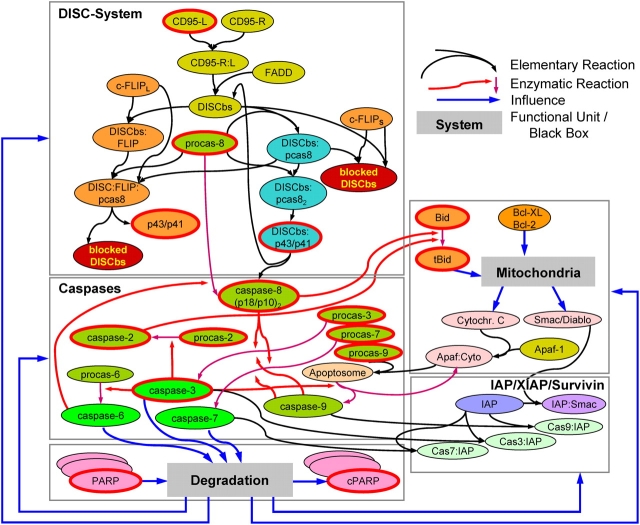
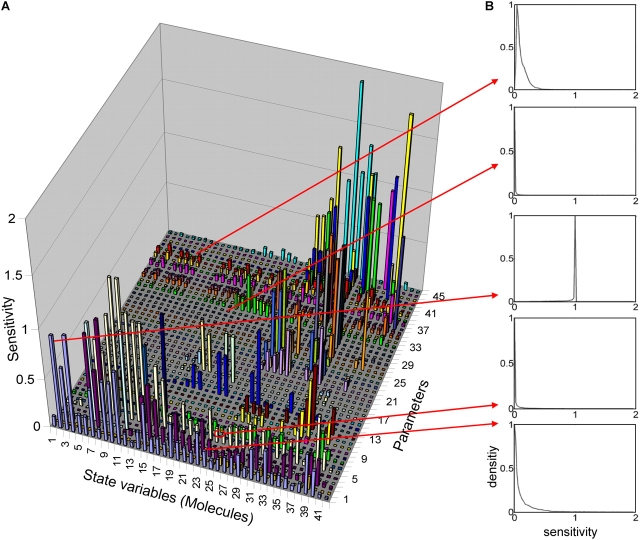
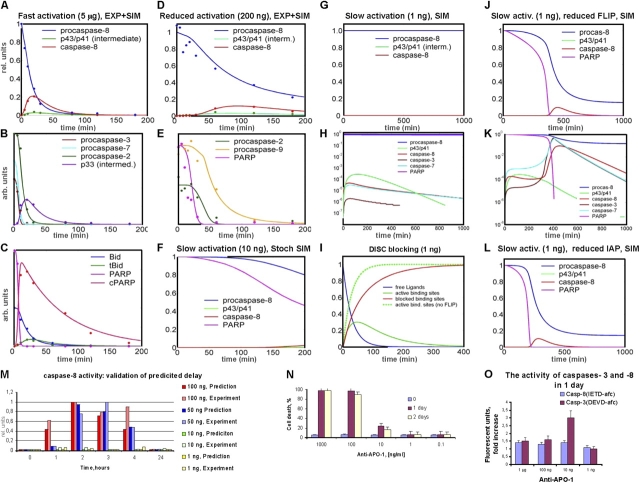
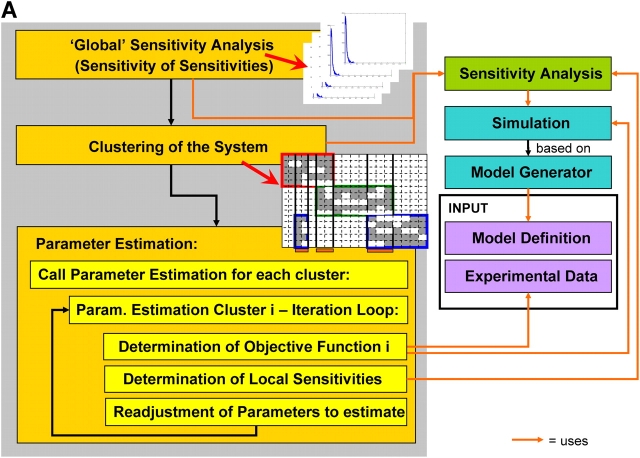
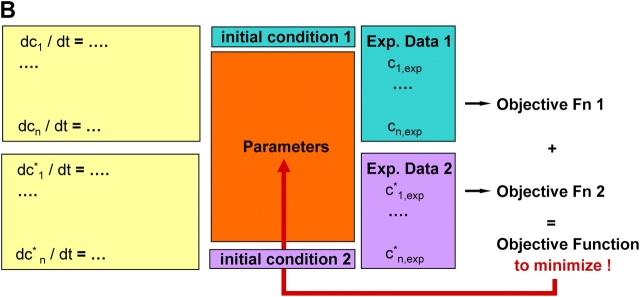
Mathematical modeling is required for understanding the complex behavior of large signal transduction networks. Previous attempts to model signal transduction pathways were often limited to small systems or based on qualitative data only. Here, we developed a mathematical modeling framework for understanding the complex signaling behavior of CD95(APO-1/Fas)-mediated apoptosis. Defects in the regulation of apoptosis result in serious diseases such as cancer, autoimmunity, and neurodegeneration. During the last decade many of the molecular mechanisms of apoptosis signaling have been examined and elucidated. A systemic understanding of apoptosis is, however, still missing. To address the complexity of apoptotic signaling we subdivided this system into subsystems of different information qualities. A new approach for sensitivity analysis within the mathematical model was key for the identification of critical system parameters and two essential system properties: modularity and robustness. Our model describes the regulation of apoptosis on a systems level and resolves the important question of a threshold mechanism for the regulation of apoptosis.


Figures

Figure 1.
Figure 1.
Structured information model of CD95-induced apoptosis. In the mechanistic part (DISC, Caspases, IAP), interactions are modeled as elementary reactions including competitive inhibitions and enzymatic reactions. Receptors are activated by ligands initiating the DISC formation. After binding to the DISC binding site (DISCbs), procaspase-8 is cleaved (initiator caspase), followed by the activation of executioner caspases (-3, -6, -7). PARP cleavage was chosen as experimental end-point of the pathway. The mitochondria and the degradation process, which influences all molecules, are modeled as black boxes defined by their input-output behavior (see Online supplemental material). Each reaction contains one or more unknown parameters. Experimental time series were measured for all molecules framed in red. For details on reactions and parameters see Table SI. Note that due to model simplifications some molecule species are replaced by virtual substitutes (e.g., XIAP and IAP1/2→”IAP”).
Figure 2.
Figure 2.
Sensitivity matrix of parameters and molecules. (A) The sensitivity matrix (sij) shows the relative changes of the concentrations of molecule i (left to right) due to a change of parameter j (front to back). The indices refer to Table SI. Sensitivities are low in general (≪1) indicating high robustness. The sensitivities of the executioner caspases (Fig. S1) are extremely low indicating the extreme robustness of the core functionality of the apoptotic system. (B) Sensitivity of sensitivities: each box shows one histogram for a specific sensitivity, calculated for 300,000 randomly chosen points in parameter space. X axis: sensitivity; Y axis: relative density of occurrence (weighted with a Boltzmann-distribution; see Online supplemental material). The histograms shown here are representative for the complete matrix. They show distinct and narrow peaks in most cases. Sensitivities with a clear peak close to zero indicate that the respective molecule concentration is insensitive to the respective parameter (an important property for further modularization).
Figure 3.
Figure 3.
Experimental data obtained for the fast activation scenario. Anti–APO-1 antibodies were added to SKW 6.4 cells in a concentration of 5 μg/ml and the samples were incubated at 37°C for various time points. Unstimulated cells were incubated in parallel for the same amount of time. (A) The cleavage of procaspase-8 was analyzed by Western blotting using anti–caspase-8 monoclonal antibodies. The positions of procaspase-8 (p55/p53) and the respective cleavage fragments are indicated. Recombinant caspase-8 in serial dilutions was loaded on the same Western blot for calibration. Above each lane the percentage of cell death is presented. As a loading control we used anti-actin monoclonal antibodies. The caspase-8 activity was analyzed using a fluorometric activity assay with z-IETD-afc. Data are presented from three independent experiments. (B) The processing of procaspase-2 was analyzed by Western blotting using anti–caspase-2 monoclonal antibodies. The positions of procaspase-2 and the respective cleavage fragments are indicated. (C and D) The processing of procaspases-3 and -7 was analyzed by Western blotting with corresponding antibodies. (E) Analysis of PARP cleavage by Western blotting.
Figure 3.
Figure 3.
Experimental data obtained for the fast activation scenario. Anti–APO-1 antibodies were added to SKW 6.4 cells in a concentration of 5 μg/ml and the samples were incubated at 37°C for various time points. Unstimulated cells were incubated in parallel for the same amount of time. (A) The cleavage of procaspase-8 was analyzed by Western blotting using anti–caspase-8 monoclonal antibodies. The positions of procaspase-8 (p55/p53) and the respective cleavage fragments are indicated. Recombinant caspase-8 in serial dilutions was loaded on the same Western blot for calibration. Above each lane the percentage of cell death is presented. As a loading control we used anti-actin monoclonal antibodies. The caspase-8 activity was analyzed using a fluorometric activity assay with z-IETD-afc. Data are presented from three independent experiments. (B) The processing of procaspase-2 was analyzed by Western blotting using anti–caspase-2 monoclonal antibodies. The positions of procaspase-2 and the respective cleavage fragments are indicated. (C and D) The processing of procaspases-3 and -7 was analyzed by Western blotting with corresponding antibodies. (E) Analysis of PARP cleavage by Western blotting.
Figure 4.
Figure 4.
Model predictions and experimental validation. (A–E) Parameter estimation on the basis of fast and reduced activation scenarios (5 μg/ml and 200 ng/ml of anti–APO-1, respectively) led to a good fit between model simulations (SIM, solid lines) and experimental data (EXP, dots) for both scenarios. (A) The high ligand concentration leads to an early activation of receptors, followed by fast DISC formation, resulting in a high cleavage capacity of procaspase-8 via the intermediate product (p43/p41). (B and C) Early generation of active caspase-8 is followed by the cleavage of caspase-3, -7, and -2 as well as by cleavage of Bid and PARP. After PARP cleavage, decomposition of cellular components starts. (D and E) The model computed for slower activation (200 ng/ml) using the same set of biochemical parameters. Due to the smaller percentage of receptors activated by ligands, the capacity of caspase-8 cleavage is much lower. However, there is still a cleavage of 100% of the executioner caspases and PARP resulting in apoptosis. (F–I) To test the hypothesis of a threshold behavior of CD95-induced apoptosis, activation was simulated for even lower ligand concentrations (10 and 1 ng/ml, respectively) using the estimated parameter set previously. Note that for the intermediate activation strength of 10 ng/ml we applied stochastic instead of deterministic simulations (for details see Online supplemental material and Bentele and Eils, 2004). As expected, caspase-8 cleavage is slowing down (F). However, for 1 ng/ml (G) the death process was completely stopped. Active caspase-8 and all the subsequent caspases could not be generated in a number sufficiently high to trigger apoptosis (H, log-scale). According to the model, c-FLIP is blocking the low number of active DISCs (see red and green curve in I) before caspase-8 can be generated in a sufficiently high amount. Without c-FLIP, the number of active DISCs and therefore their cleavage capacity would be significantly higher (dotted line in I). (J and K) The simulation for c-FLIP reduced by 75% shows a slow and steady cleavage of procaspase-8 until caspase-3 is generated in a number sufficiently high to trigger the feedback loop via caspase-6, accelerating the activation of caspase-8 and resulting in apoptosis after a delay of many hours (compare H and K on a log-scale). (L) A similar effect could be simulated for IAP reduced by 75% showing the importance of this inhibitor in case of slow activations (compare G and L). (M) Caspase-8 activity: the model predictions for slow activation scenarios (ligand concentrations between 100 and 1 ng/ml) were confirmed by experiments. In particular, the predicted delay of caspase activation was quantitatively validated. In the 10 ng/ml activation scenario, a significant increase of active caspase-8 was observed after more than 4 h (data not shown) as predicted in panel F, whereas no increase occurred for 1 ng/ml. (N) The death rates are in a good agreement with the model, which predicts triggering of the death process for the scenarios of 10 ng/ml and above. However, the measured death rate for 10 ng/ml was below 100%. Note that these rates were measured for a population of many cells whereas deterministic simulations address single cells (or a population of many cells with exactly the same parameters and initial conditions, respectively). Variability of parameters and of numbers of ligands as well as intrinsic stochastic effects due to low particle numbers might account for fluctuations in scenarios close to the activation threshold. Accordingly, simulations for slightly different parameter values in this scenario showed that the time-point of apoptosis is highly variable or apoptosis does not take place at all (data not shown) resulting in a death rate of below 100% for the cell population. (O) In the subthreshold scenario, only an extremely low increase of active caspase-8 and no increase of active caspase-3 was measured (y axis shows the -fold increase). For higher ligand concentrations, the low caspase activity is due to prior degradation. Y axis for A–L: arbitrary units (except for A and D where the [pro-]caspase concentrations are directly comparable and thus given in relative units). The standard deviation of experimental data was 20% on average.
Figure 5.
Figure 5.
Framework for modeling and simulation of large signal transduction networks. (A) Before parameter estimation, sensitivities are determined for randomly chosen points in parameter space. All sensitivities with a distinct peak close to zero are considered irrelevant (compare Fig. 2). In the next step (clustering), irrelevant sensitivities are removed (white squares), and the matrix is rearranged in a way that provides independent clusters (see Online supplemental material). On this basis, the parameter estimation is performed for each cluster independently by minimization of the respective objective function. In case of global parameters, the parameter estimation for the single clusters is recursively called within the parameter estimation for the global parameters. The right-hand side displays the core part of the computational system. Whenever sensitivity analysis is applied or the objective function has to be determined for parameter estimation, the simulation is started with a certain parameter set. The simulation is based on the biochemical reaction equations and on the definition of the black boxes, which are automatically translated into a system of differential equations (model generation). The result of the simulation is used to evaluate sensitivities and the objective function by comparing model predictions with experimental data. (B) Additional information can be gained by measuring the dynamic system behavior under different initial conditions. The unknown parameters are estimated for all different initial conditions at once. These scenarios are simulated in parallel. The maximum likelihood estimation minimizes the sum of the respective objective functions depending on the corresponding experimental datasets.
Figure 5.
Figure 5.
Framework for modeling and simulation of large signal transduction networks. (A) Before parameter estimation, sensitivities are determined for randomly chosen points in parameter space. All sensitivities with a distinct peak close to zero are considered irrelevant (compare Fig. 2). In the next step (clustering), irrelevant sensitivities are removed (white squares), and the matrix is rearranged in a way that provides independent clusters (see Online supplemental material). On this basis, the parameter estimation is performed for each cluster independently by minimization of the respective objective function. In case of global parameters, the parameter estimation for the single clusters is recursively called within the parameter estimation for the global parameters. The right-hand side displays the core part of the computational system. Whenever sensitivity analysis is applied or the objective function has to be determined for parameter estimation, the simulation is started with a certain parameter set. The simulation is based on the biochemical reaction equations and on the definition of the black boxes, which are automatically translated into a system of differential equations (model generation). The result of the simulation is used to evaluate sensitivities and the objective function by comparing model predictions with experimental data. (B) Additional information can be gained by measuring the dynamic system behavior under different initial conditions. The unknown parameters are estimated for all different initial conditions at once. These scenarios are simulated in parallel. The maximum likelihood estimation minimizes the sum of the respective objective functions depending on the corresponding experimental datasets.
Figure 6.
Figure 6.
Activation with lower ligand concentration. Anti–APO-1 antibodies were added to SKW 6.4 cells in a concentration of 200 ng/ml and the samples were incubated at 37°C for various time points. (A) The cleavage of procaspase-8 was analyzed by Western blotting using anti–caspase-8 monoclonal antibodies. The positions of procaspase-8 (p55/p53) and the respective cleavage fragments are indicated. (B) The cleavage of procaspase-9 was analyzed by Western blotting using anti–caspase-9 monoclonal antibodies. (C) The processing of procaspase-2 was analyzed by Western blotting. (D) Analysis of PARP cleavage.
Figure 6.
Figure 6.
Activation with lower ligand concentration. Anti–APO-1 antibodies were added to SKW 6.4 cells in a concentration of 200 ng/ml and the samples were incubated at 37°C for various time points. (A) The cleavage of procaspase-8 was analyzed by Western blotting using anti–caspase-8 monoclonal antibodies. The positions of procaspase-8 (p55/p53) and the respective cleavage fragments are indicated. (B) The cleavage of procaspase-9 was analyzed by Western blotting using anti–caspase-9 monoclonal antibodies. (C) The processing of procaspase-2 was analyzed by Western blotting. (D) Analysis of PARP cleavage.
Figure 7.
Figure 7.
Summary sentence to be provided. (A) SKW 6.4 cells were treated with CHX for 2 h. Thereafter, cells were stimulated with indicated concentrations of anti–APO-1 antibodies for one day. Cell death was determined using FACS analysis. (B) Amounts c-FLIP and procaspases-8, -3, and -9 before and after CHX treatment were analyzed by immunoblotting. (C) SKW 6.4 cells were treated with CHX and anti–APO-1 antibodies as in A. The cleavage of procaspase-8 was analyzed by Western blotting using anti–caspase-8 antibody.
Figure 7.
Figure 7.
Summary sentence to be provided. (A) SKW 6.4 cells were treated with CHX for 2 h. Thereafter, cells were stimulated with indicated concentrations of anti–APO-1 antibodies for one day. Cell death was determined using FACS analysis. (B) Amounts c-FLIP and procaspases-8, -3, and -9 before and after CHX treatment were analyzed by immunoblotting. (C) SKW 6.4 cells were treated with CHX and anti–APO-1 antibodies as in A. The cleavage of procaspase-8 was analyzed by Western blotting using anti–caspase-8 antibody.
Figure 8.
Figure 8.
Activation with threshold ligand concentration. Anti–APO-1 antibodies were added to SKW 6.4 cells in concentrations of 100 and 1 ng/ml, respectively, and the samples were incubated at 37°C for 1 d. For 1 ng/ml, neither cell death nor any significant caspase-3 and -8 activities were observed (compare Fig. 4). Upon stimulation with 100 ng/ml the cells were dead after 1 d and some residual caspase-3 and -8 activities were monitored. The levels of expression of different apoptotic molecules were monitored by Western blot and are presented for (A) procaspase-8, (B) procaspase-3, (C) procaspase-9, (D) c-Flip, (D) PARP, and (E) procaspase-2.
Figure 9.
Figure 9.
Down-regulation of c-FLIP results in abolishing the threshold of CD95-induced apoptosis. (A) Virtual experiment for a ligand concentration of 1 ng under the assumption that c-FLIP is not blocking the DISCs in an early stage, resulting in a steady caspase-8 cleavage. The amplification loop is not considered for 1 ng to show the caspase-8 cleavage contribution of the DISCs only. For comparison, the active caspase-8 concentrations for 200 ng and 5 μg are given (corresponding to Fig. 4, A and D). Thus, even for the low ligand concentration of 1 ng, caspase-8 activity would reach a level in the same range as in case of high ligand concentrations (even though delayed). The relative units refer to the initial concentration of procaspase-8. (B) Complete scenario with amplification loop, simulated under the assumption that c-FLIP does not block the DISCs for 1 ng: the steady increase of active caspase-8 would trigger the complete death process. For comparison, the 200-ng scenario is plotted (corresponding to Fig. 4 D). Assuming that c-FLIP does not effectively block the DISCs for extremely low ligand concentrations, we expect a similar process as triggered by much higher ligand concentrations.

References

    1. Alon, U., M.G. Surette, N. Barkai, and S. Leibler. 1999. Robustness in bacterial chemotaxis. Nature. 397:168–171. - PubMed
    1. Ashkenazi, A., and V. Dixit. 1999. Apoptosis control by death and decoy receptors. Curr. Opin. Cell Biol. 11:255–260. - PubMed
    1. Bentele, M., and R. Eils. 2004. General stochastic hybrid method for the simulation of chemical reaction processes in cells. In CMSB ‘04. Lecture Notes in Computer Science. Springer, Heidelberg. In press.
    1. Bhalla, U.S., and R. Iyengar. 1999. Emergent properties of networks of biological signaling pathways. Science. 283:381–387. - PubMed
    1. Carlson, J.M., and J.C. Doyle. 2002. Complexity and robustness. Proc. Natl. Acad. Sci. USA. 99:2538–2545. - PMC - PubMed

Publication types