

Gating of the bacterial sodium channel, NaChBac: voltage-dependent charge movement and gating currents
- PMID: 15365092
- PMCID: PMC2233907
- DOI: 10.1085/jgp.200409139
Gating of the bacterial sodium channel, NaChBac: voltage-dependent charge movement and gating currents
Abstract
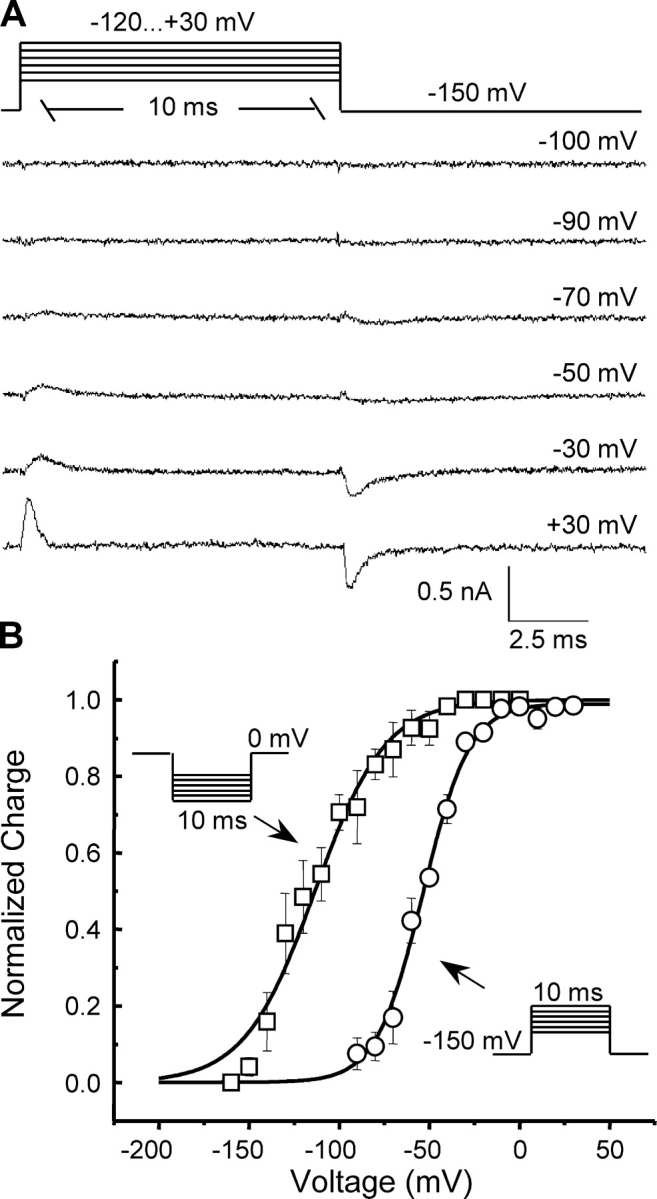
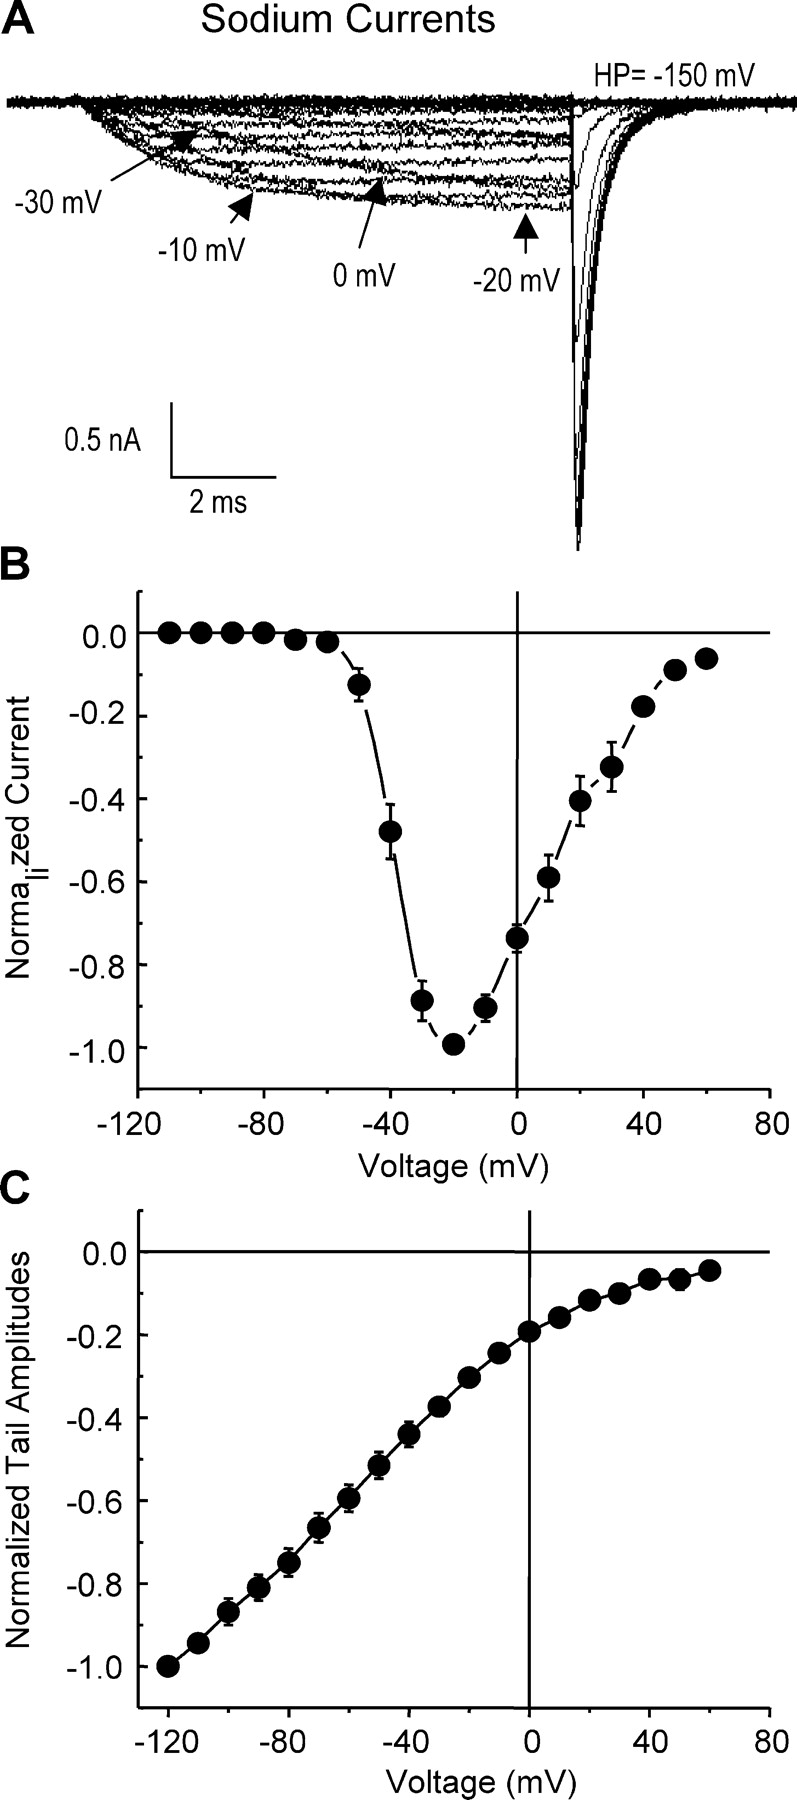
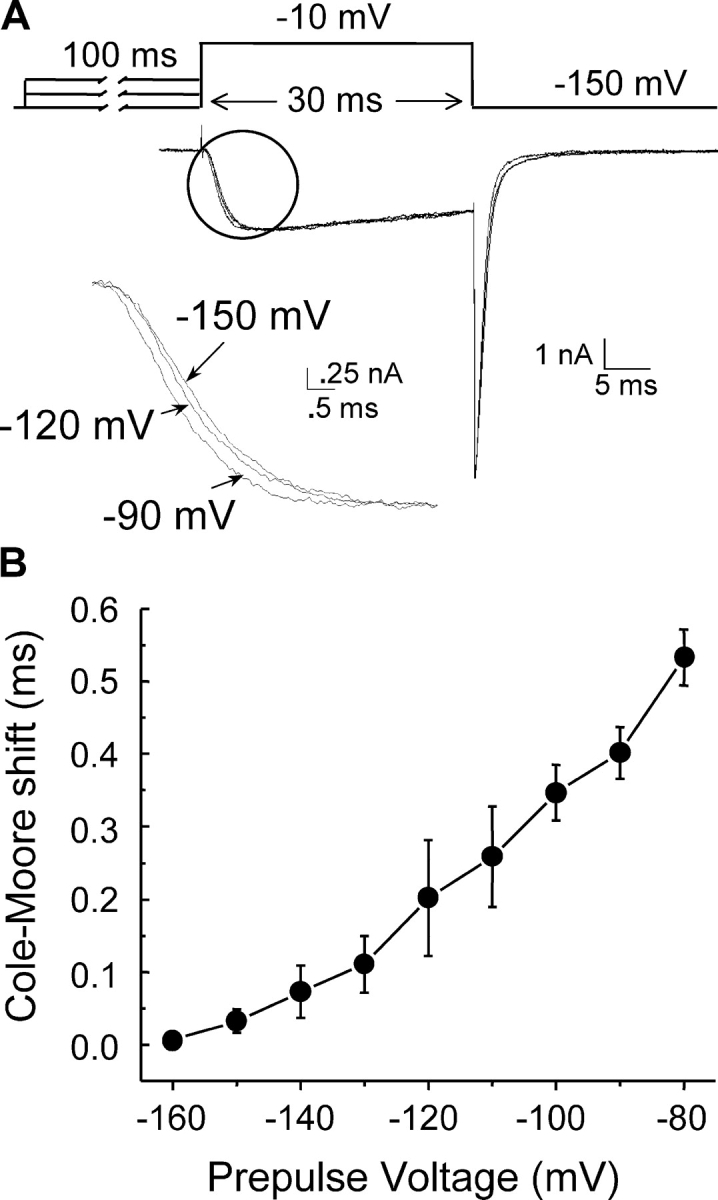
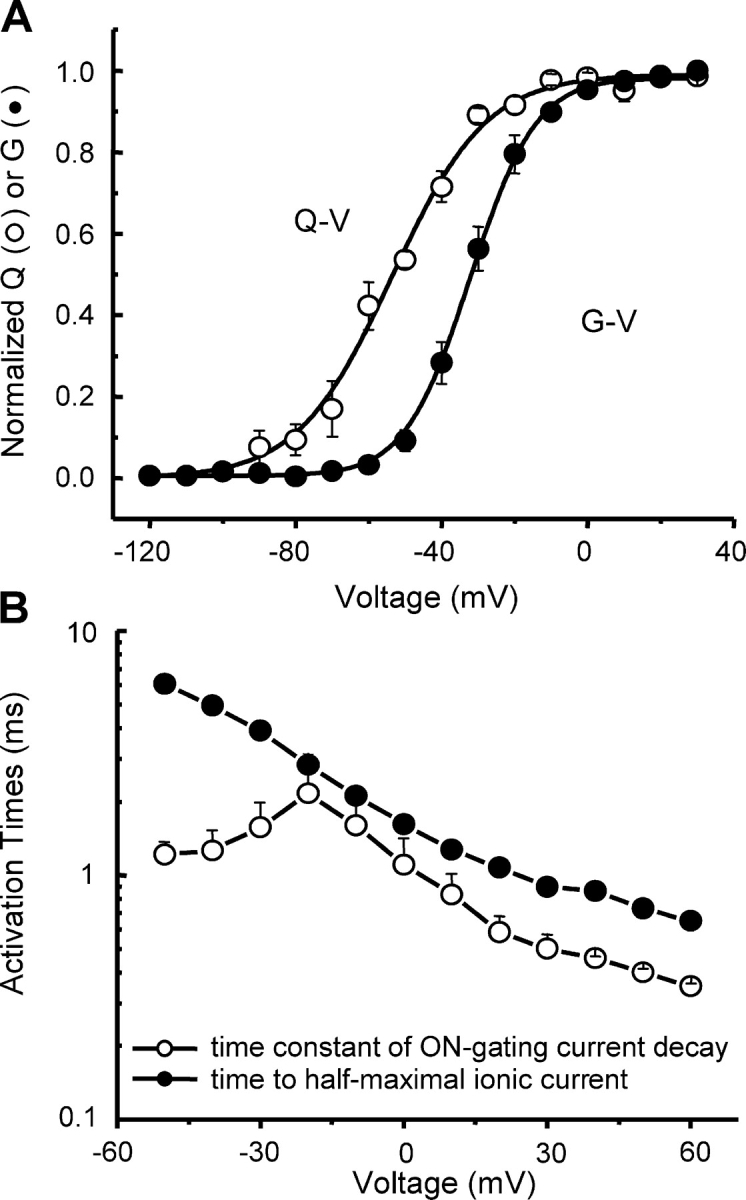
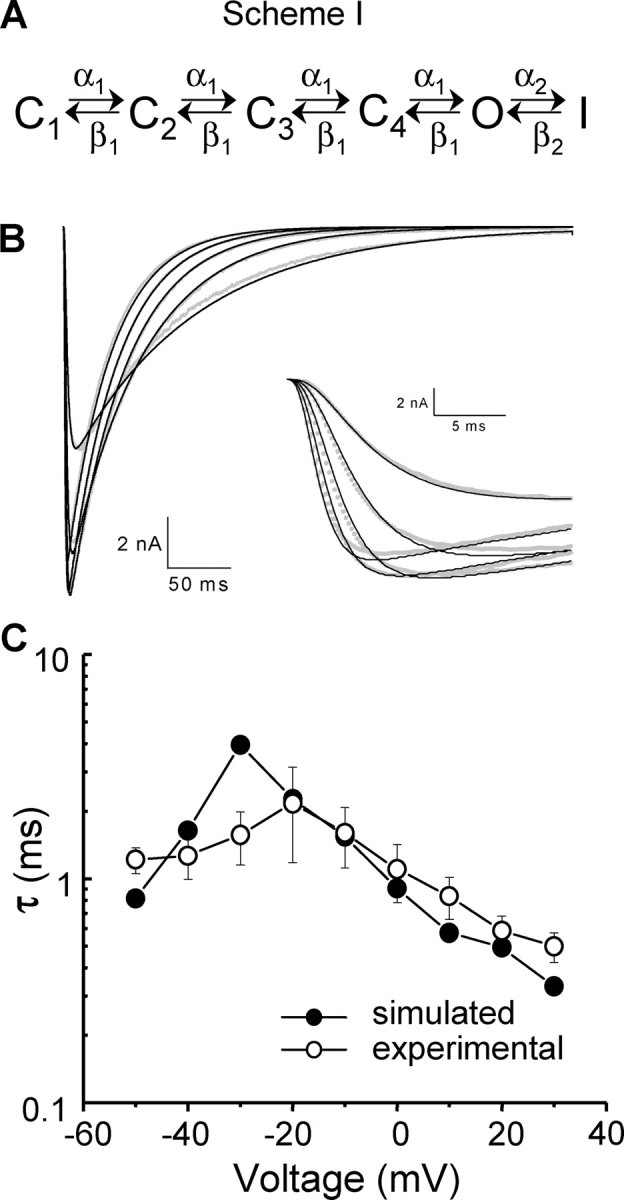
The bacterial sodium channel, NaChBac, from Bacillus halodurans provides an excellent model to study structure-function relationships of voltage-gated ion channels. It can be expressed in mammalian cells for functional studies as well as in bacterial cultures as starting material for protein purification for fine biochemical and biophysical studies. Macroscopic functional properties of NaChBac have been described previously (Ren, D., B. Navarro, H. Xu, L. Yue, Q. Shi, and D.E. Clapham. 2001. Science. 294:2372-2375). In this study, we report gating current properties of NaChBac expressed in COS-1 cells. Upon depolarization of the membrane, gating currents appeared as upward inflections preceding the ionic currents. Gating currents were detectable at -90 mV while holding at -150 mV. Charge-voltage (Q-V) curves showed sigmoidal dependence on voltage with gating charge saturating at -10 mV. Charge movement was shifted by -22 mV relative to the conductance-voltage curve, indicating the presence of more than one closed state. Consistent with this was the Cole-Moore shift of 533 micros observed for a change in preconditioning voltage from -160 to -80 mV. The total gating charge was estimated to be 16 elementary charges per channel. Charge immobilization caused by prolonged depolarization was also observed; Q-V curves were shifted by approximately -60 mV to hyperpolarized potentials when cells were held at 0 mV. The kinetic properties of NaChBac were simulated by simultaneous fit of sodium currents at various voltages to a sequential kinetic model. Gating current kinetics predicted from ionic current experiments resembled the experimental data, indicating that gating currents are coupled to activation of NaChBac and confirming the assertion that this channel undergoes several transitions between closed states before channel opening. The results indicate that NaChBac has several closed states with voltage-dependent transitions between them realized by translocation of gating charge that causes activation of the channel.
Figures
Similar articles
-
Coupling between charge movement and pore opening in voltage dependent potassium channels.Medicina (B Aires). 1995;55(5 Pt 2):591-9. Medicina (B Aires). 1995. PMID: 8842189
-
The cation selectivity filter of the bacterial sodium channel, NaChBac.J Gen Physiol. 2002 Dec;120(6):845-53. doi: 10.1085/jgp.20028699. J Gen Physiol. 2002. PMID: 12451053 Free PMC article.
-
Tracking S4 movement by gating pore currents in the bacterial sodium channel NaChBac.J Gen Physiol. 2014 Aug;144(2):147-57. doi: 10.1085/jgp.201411210. J Gen Physiol. 2014. PMID: 25070432 Free PMC article.
-
Gating currents.J Gen Physiol. 2018 Jul 2;150(7):911-932. doi: 10.1085/jgp.201812090. Epub 2018 Jun 25. J Gen Physiol. 2018. PMID: 29941430 Free PMC article. Review.
-
Voltage-gated sodium and calcium channels in nerve, muscle, and heart.IEEE Trans Nanobioscience. 2005 Mar;4(1):58-69. doi: 10.1109/tnb.2004.842500. IEEE Trans Nanobioscience. 2005. PMID: 15816172 Review.
Cited by
-
Exploring conformational states of the bacterial voltage-gated sodium channel NavAb via molecular dynamics simulations.Proc Natl Acad Sci U S A. 2012 Dec 26;109(52):21336-41. doi: 10.1073/pnas.1218087109. Epub 2012 Nov 12. Proc Natl Acad Sci U S A. 2012. PMID: 23150565 Free PMC article.
-
The isolated voltage sensing domain of the Shaker potassium channel forms a voltage-gated cation channel.Elife. 2016 Oct 6;5:e18130. doi: 10.7554/eLife.18130. Elife. 2016. PMID: 27710769 Free PMC article.
-
Gating of the HypoPP-1 mutations: I. Mutant-specific effects and cooperativity.Pflugers Arch. 2007 Jun;454(3):495-505. doi: 10.1007/s00424-007-0225-3. Epub 2007 Feb 27. Pflugers Arch. 2007. PMID: 17333249
-
Uncovering Zn2+ as a cofactor of FAD-dependent Pseudomonas aeruginosa PAO1 d-2-hydroxyglutarate dehydrogenase.J Biol Chem. 2023 Mar;299(3):103007. doi: 10.1016/j.jbc.2023.103007. Epub 2023 Feb 11. J Biol Chem. 2023. PMID: 36775126 Free PMC article.
-
The complete structure of an activated open sodium channel.Nat Commun. 2017 Feb 16;8:14205. doi: 10.1038/ncomms14205. Nat Commun. 2017. PMID: 28205548 Free PMC article.
References
-
- Aggarwal, S.K., and R. MacKinnon. 1996. Contribution of the S4 segment to gating charge in the Shaker K+ channel. Neuron. 16:1169–1177. - PubMed
-
- Almers, W. 1978. Gating currents and charge movements in excitatory membranes. Rev. Physiol. Biochem. Pharmacol. 82:96–190. - PubMed
-
- Armstrong, C.M., and F. Bezanilla. 1973. Currents related to movement of the gating particles of the sodium channels. Nature. 242:459–461. - PubMed
-
- Bezanilla, F. 2000. The voltage sensor in voltage-dependent ion channels. Physiol. Rev. 80:555–592. - PubMed
