. 2004 Oct;124(4):301-17.
doi: 10.1085/jgp.200409041. Epub 2004 Sep 13.

Mechanism of block of hEag1 K+ channels by imipramine and astemizole

Affiliations

Mechanism of block of hEag1 K+ channels by imipramine and astemizole

Rafael E García-Ferreiro et al. J Gen Physiol. 2004 Oct.

Abstract

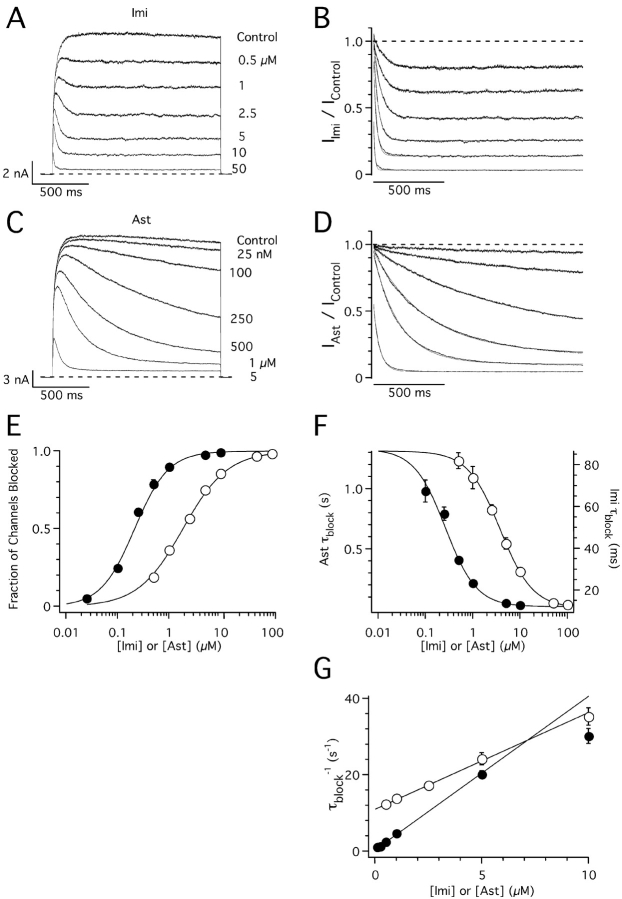
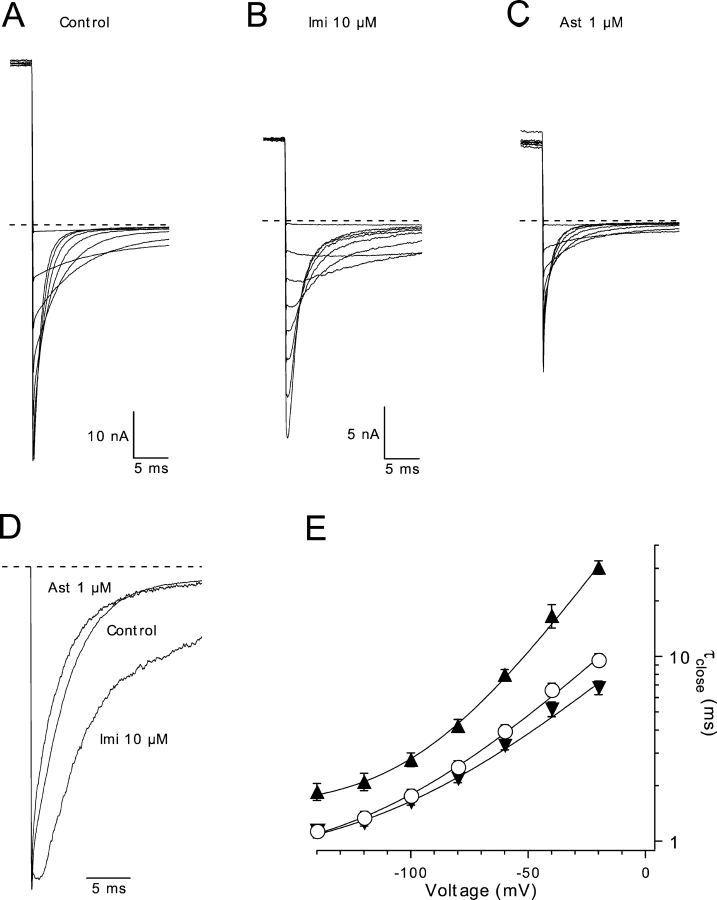
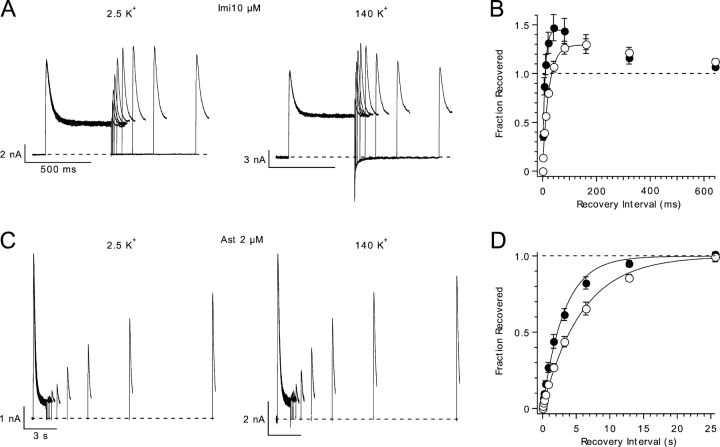
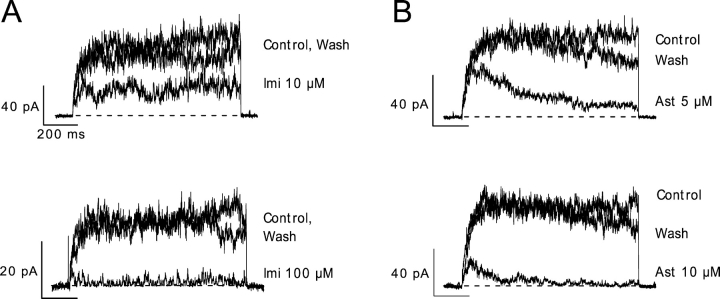
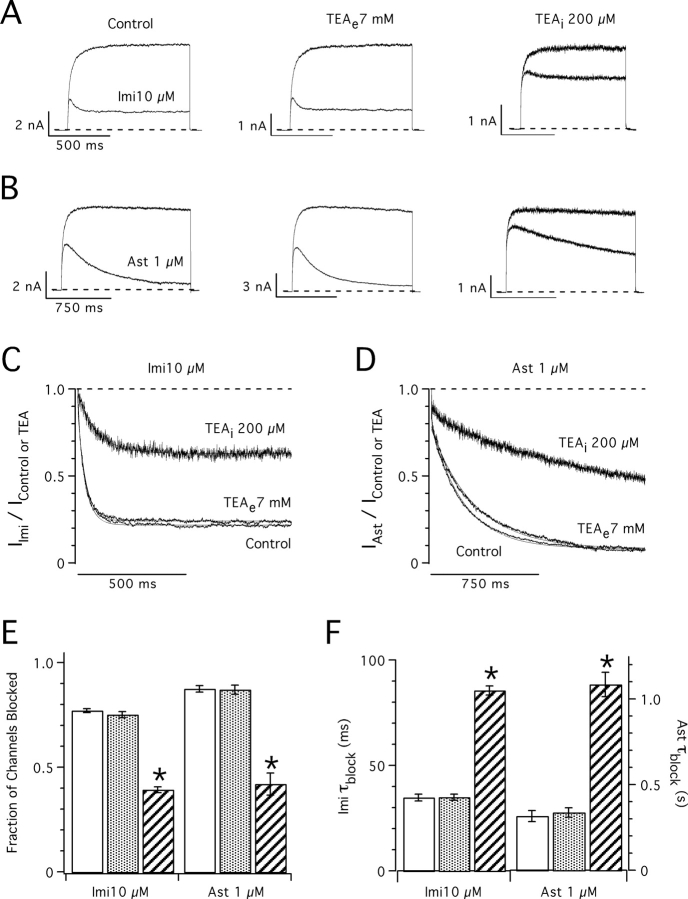
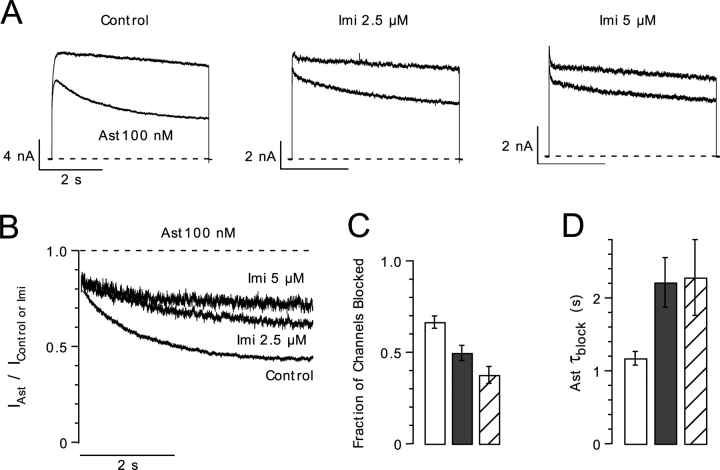
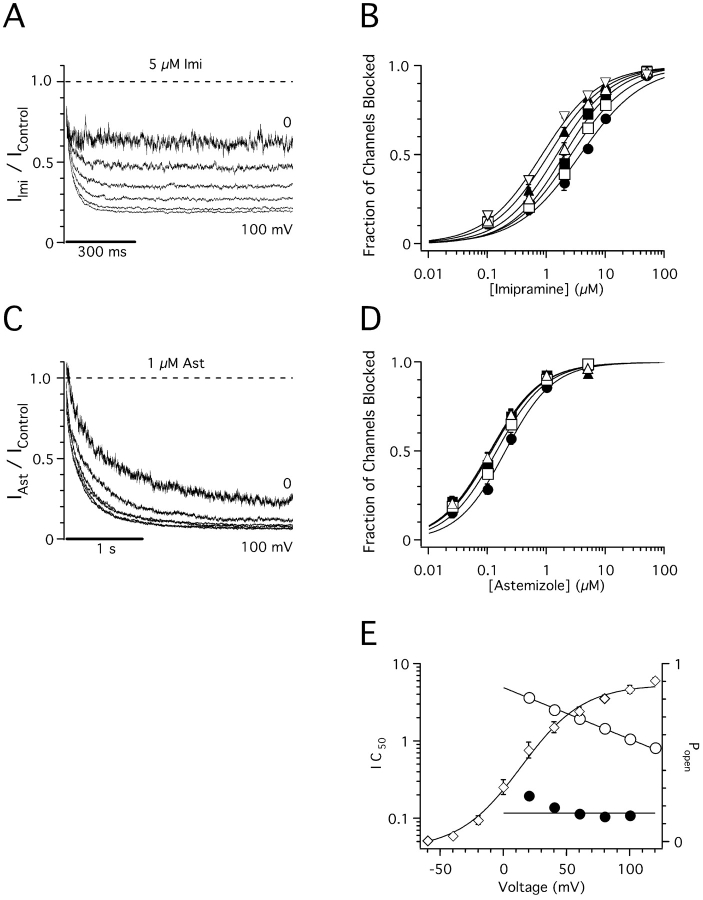
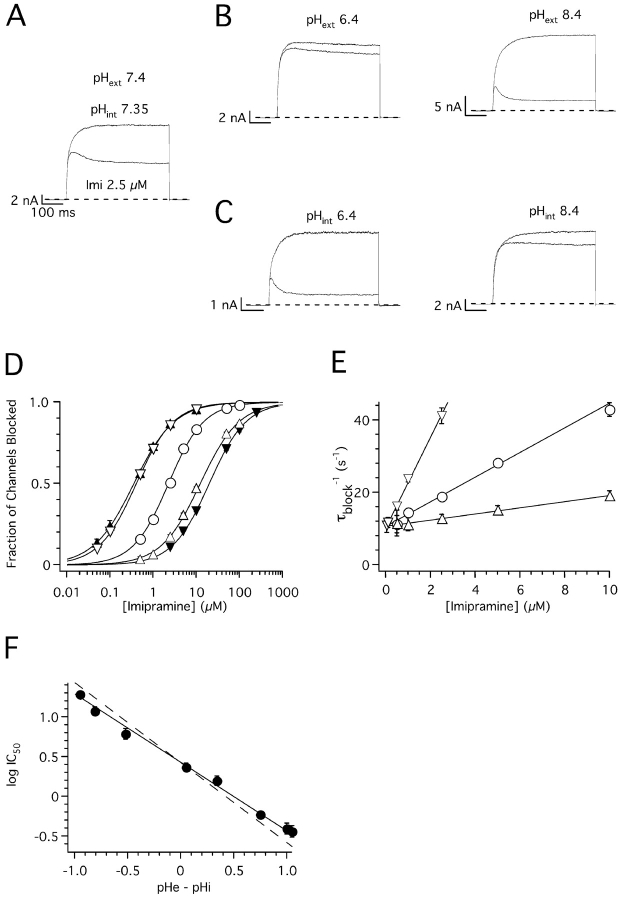
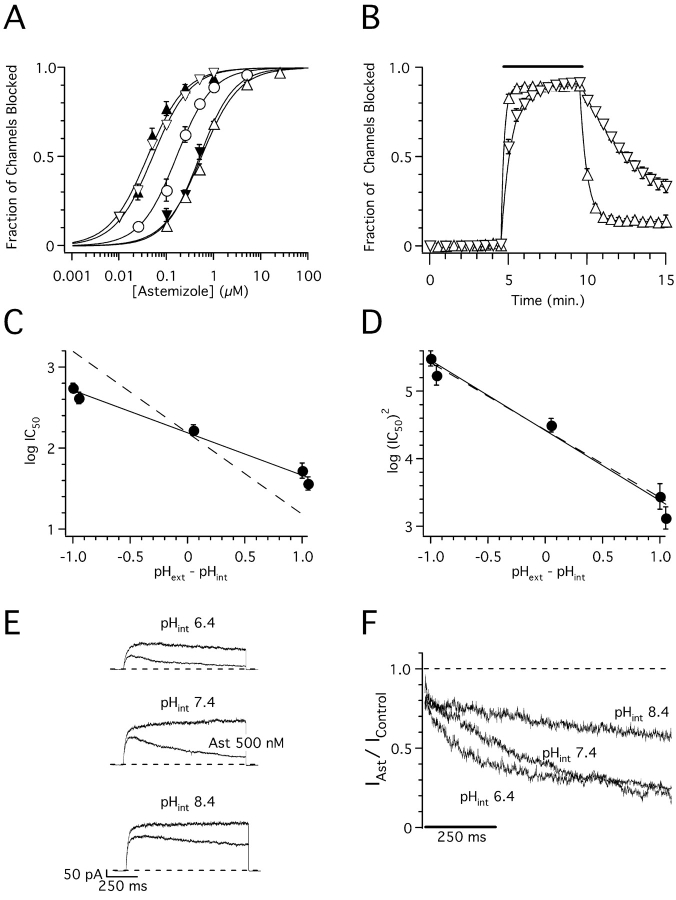
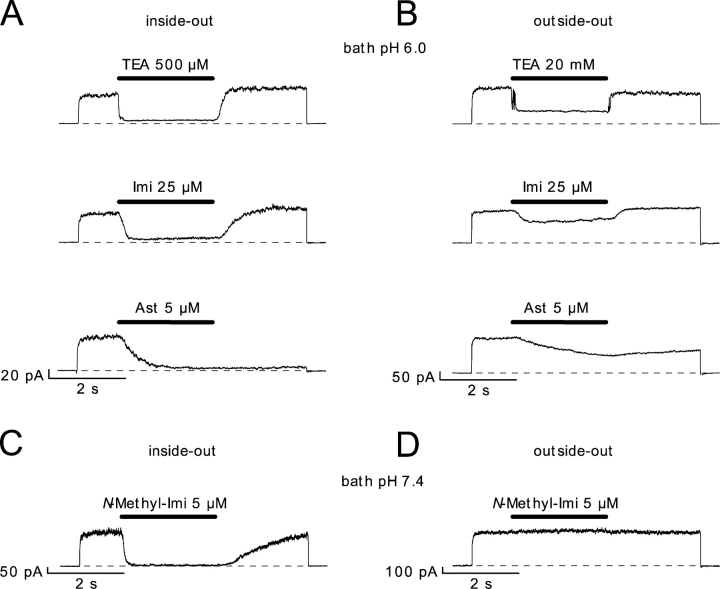
Ether à go-go (Eag; KV10.1) voltage-gated K+ channels have been detected in cancer cell lines of diverse origin and shown to influence their rate of proliferation. The tricyclic antidepressant imipramine and the antihistamine astemizole inhibit the current through Eag1 channels and reduce the proliferation of cancer cells. Here we describe the mechanism by which both drugs block human Eag1 (hEag1) channels. Even if both drugs differ in their affinity for hEag1 channels (IC50s are approximately 2 microM for imipramine and approximately 200 nM for astemizole) and in their blocking kinetics, both drugs permeate the membrane and inhibit the hEag1 current by selectively binding to open channels. Furthermore, both drugs are weak bases and the IC50s depend on both internal an external pH, suggesting that both substances cross the membrane in their uncharged form and act from inside the cell in their charged forms. Accordingly, the block by imipramine is voltage dependent and antagonized by intracellular TEA, consistent with imipramine binding in its charged form to a site located close to the inner end of the selectivity filter. Using inside- and outside-out patch recordings, we found that a permanently charged, quaternary derivative of imipramine (N-methyl-imipramine) only blocks channels from the intracellular side of the membrane. In contrast, the block by astemizole is voltage independent. However, as astemizole competes with imipramine and intracellular TEA for binding to the channel, it is proposed to interact with an overlapping intracellular binding site. The significance of these findings, in the context of structure-function of channels of the eag family is discussed.


Figures

F<sc>igure</sc> 1.
Figure 1.
Concentration dependence of hEag1 block by imipramine and astemizole. (A and C) Superimposed hEag1 current traces recorded during 1.5 s test depolarizations to 80 mV from a holding potential of −70 mV in the absence and presence of the indicated concentrations of imipramine (Imi, A) or astemizole (Ast, C). Test potential was chosen to achieve the maximal open probability of hEag1, whose activation curve saturates above 60 mV (not depicted). The effects of drug application were monitored with test pulses applied every 30 s until a steady-state block was reached. (B and D) Current traces in the presence of imipramine or astemizole were normalized dividing them point by point by the respective preapplication traces. Solid lines indicate the best fit to a single exponential function. (E) Dose–response plots for imipramine (open circles) and astemizole (closed circles). The steady-state fraction of channels blocked was calculated from the asymptotic values of single exponential fits to current ratios as shown in B and D. Solid lines represent fits to the data using the Hill equation, with IC50 values and Hill coefficients of 1.87 μM and 1.04 for imipramine, and 0.21 μM and 1.32 for astemizole, respectively. (D) Time constant of block (τblock) for imipramine (open circles) and astemizole (closed circles) derived from the least-squares fits of single exponential functions used in E. Solid lines represent fits to the data using the Hill equations, with maximum, minimum, IC50, and Hill coefficients of 86.7 ms, 11.6 ms, 3.75 μM, and 1.27 for imipramine, and 1.33 s, 0.024 s, 0.26 μM, and 1.32 for astemizole, respectively. (G) The rate of current block is represented (τblock −1) as a linear function of nonsaturating imipramine (open circles) or astemizole (closed circles) concentrations. Solid lines represent fits to the data with a linear function, with slope and y intercept of 2.5 s−1μM−1 and 11.1 μM for imipramine, and 4 s−1μM−1 and 0.4 μM for astemizole, respectively. The range of drug concentrations used to fit τblock −1 data to the linear function was between 0.5 and 10 μM for imipramine and between 25 nM and 5 μM for astemizole. Symbols and associated error bars in E–G represent means ± SEM for six and seven cells for imipramine and astemizole, respectively.
(SCHEME 1)
(SCHEME 1)
F<sc>igure</sc> 2.
Figure 2.
Deactivation kinetics in the presence of imipramine and astemizole. (A–C) Superimposed tail current traces recorded at potentials between −140 and 0 mV after 330-ms depolarizations to 80 mV from a holding potential of −60 mV in the absence of drugs (A), and in the presence of 10 μM imipramine (B) and 1 μM astemizole (C). All traces were recorded consecutively from the same cell. (D) Scaled tail current traces from A–C recorded at −60 mV. (E) Average time constant of a single exponential fit to the decay phase of the tail current (τclose) recorded in control conditions (open circles), 10 μM imipramine (closed triangles), and 1 μM astemizole (inverted closed triangles). Solid lines represent fits to the data with an arbitrary exponential function: τclose(V) = τ + τ(0) e−kV, with τ , τ(0), and k values of 0.75 ms, 15.87 ms, and −0.027 (control); 1.52 ms, 65.13 ms, and −0.039 (imipramine); and 0.75 ms, 10.75 ms, and −0.025 (astemizole), respectively. Symbols and associated error bars represent means ± SEM for five cells.
F<sc>igure</sc> 3.
Figure 3.
Influence of high extracellular K+ on the recovery from imipramine and astemizole block. (A) Recovery of hEag1 at −70 mV from block by 10 μM imipramine with 2.5 (left) or 140 mM external K+ (right) is demonstrated using two depolarizations to 100 mV from a holding potential of −70 mV separated by an interval of variable duration. The first depolarization is 500 ms long, and the first 100 ms from the second depolarization is shown. (B) Time course of recovery from imipramine block in low (open circles) and high extracellular [K+] (closed circles). The fraction of channels that have recovered by the time of the second depolarization (Fraction Recovered) is calculated as: Fraction Recovered = (I2 − ISS)/(I1 − ISS), where I1 and I2 represent peak current during the first and second pulse, respectively, and ISS represents the sustained current at the end of the first pulse. The solid lines are single exponential fits with time constants and asymptotic values of 8.7 ms and 1.45, and 23.7 ms and 1.3 for 2.5 and 140 mM external K+, respectively. (C) Recovery of hEag1 at −70 mV from block by 2 μM astemizole in low (left) or high (right) concentrations of external K+. Two depolarizations to 80 mV from a holding potential of −70 mV were applied separated by a variable interval. The first depolarization is 1 s long, and the first 250 ms from the second depolarization is shown. (D) Time course of recovery from astemizole block in low (open circles) and high extracellular K+ (closed circles). Fraction of channels recovered was calculated as in B. The solid lines are single exponential fits with time constants of 5.8 and 3.2 s, for 2.5 and 140 mM external K+, respectively.
F<sc>igure</sc> 4.
Figure 4.
Membrane permeability of imipramine and astemizole. Superimposed hEag1 current traces recorded during 1-s depolarizations to 60 mV from a holding potential of −70 mV in the absence, presence, and after washout of the indicated bath concentrations of imipramine (A) or astemizole (B) in cell-attached patches.
F<sc>igure</sc> 5.
Figure 5.
Competition of imipramine and astemizole with internal TEA. (A and B) Superimposed hEag1 current traces recorded during 1-s (A) or 1.5-s (B) depolarizations to 80 mV from a holding potential of −70 mV. The indicated concentrations of imipramine (A) or astemizole (B) were applied in control conditions (left), in the presence of 7 mM TEA in the external solution (TEAe; middle), or in the presence of 200 μM TEA in the internal solution (TEAi; right). Both external and internal concentrations of TEA+ were chosen to achieve ∼50% of current block by this cation. (C and D) Current traces in the presence of imipramine (A) or astemizole (B) were normalized dividing them point by point by the respective preapplication traces. Solid traces through the points indicate the best fit to a single exponential function. (E) Steady-state fraction of channels blocked was calculated from the asymptotic values of single exponential functions fit to current ratios as shown in C and D. (F) Time constant of block (τblock) derived from the least-squares fits of single exponentials used in E. Columns and associated error bars in E and F represent means ± SEM for five cells recorded in control conditions (open columns), and in the presence of external TEA (closed columns), and five cells recorded in the presence of internal TEA (hatched columns).
F<sc>igure</sc> 6.
Figure 6.
Competition of imipramine and astemizole for overlapping binding sites. (A) Superimposed hEag1 current traces recorded during 5-s depolarizations to 60 mV from a holding potential of −70 mV in the absence (top) and presence (bottom) of 100 nM astemizole, in control external solution (left) or in external solutions containing 2.5 (center) or 5 μM (right) imipramine. (B) Current traces in the presence of astemizole from A were normalized by a point-wise division by the respective preapplication control trace. (C) The steady-state fraction of channels blocked was calculated from the asymptotic values of single exponential functions fit to the respective current ratios, as shown in B. (D) Single time constant (τblock) of exponential fits used in C. Columns and associated error bars in C and D represent the means ± SEM for five cells tested in control conditions (open columns), and in the presence of 2.5 (closed columns) or 5 μM imipramine (hatched columns).
F<sc>igure</sc> 7.
Figure 7.
Voltage dependence of imipramine and astemizole block of hEag1 channels. (A and C) Current traces recorded during 1-s (A) or 3-s (C) depolarizations to potentials between 0 and 100 mV in the presence of 5 μM imipramine (A) or 1 μM astemizole (C) were normalized dividing them point by point by the respective preapplication control traces at each potential. (B and D) Dose–response plots for imipramine (B) and astemizole (D) at membrane potentials of 20 (filled circles), 40 (open squares), 60 (filled squares), 80 (open upright triangles), 100 (filled upright triangles), and 120 mV (open inverted triangles). The steady-state fraction of channels blocked was calculated from the asymptotic values of single exponential fits to current ratios, as shown in A and C using test depolarizations of 1 and 1.5 s for imipramine and astemizole, respectively. The data were fitted using the Hill equation (solid lines). IC50 values are plotted in E as a function of test potential. Symbols and associated error bars in B and D represent mean ± SEM for three (0.1, 2, 5, and 50 μM) and five (0.5 and 5 μM) cells for imipramine, and six (0.1, 1, and 5 μM) and nine (0.025 and 0.25 μM) cells for astemizole. (E, left axis) IC50 values derived from A (open circles) or B (closed circles) plotted as a function of the test potential. Solid line through imipramine data represents the fit to the data to Eq. 2, with IC50(0), and zδ values of 4.92 μM and −0.39 e0, respectively. Solid line through astemizole data represents the equation IC50(V) = 0.12 μM. (E, right axis) Open probability of hEag1 channels at the different test potentials (Popen; open diamonds). Popen was defined as the fractional tail current recorded after a given test pulse to that recorded after a test pulse to 160 mV. Isochronal tail currents were measured at −80 mV, 500 μs after the end of the 50-ms test pulse in an external solution containing 50 mM K+ and no Mg2+. Symbols and associated error bars represent mean ± SEM for six cells. Solid line through Popen data represents the best fit to a Boltzmann equation with half activation at 13.8 mV.
F<sc>igure</sc> 8.
Figure 8.
pH dependence of imipramine block of hEag1 channels. (A–C) Superimposed whole-cell current traces recorded during 1-s depolarizations to 80 mV from a holding potential of −70 mV in the absence (top) and presence (bottom) of 2.5 μM imipramine. Currents were recorded in control external and internal solutions (A), or in conditions where either the pH of the external (pHext; B) or internal solutions (pHint; C) was varied to the indicated values. (D) Dose–response plots for imipramine at pHext//pHint relations of 7.4//7.35 (open circles), 6.4//7.35 (closed inverted triangles), 8.4//7.35 (closed triangles), 7.4//6.4 (open inverted triangles), and 7.4//8.4 (open upright triangles). The steady-state fraction of channels blocked was calculated as in Fig. 1 B. The data were fitted using the Hill equation (solid lines, see text for average IC50). (E) Rate of current block (τblock −1) as a function of nonsaturating imipramine concentrations recorded at pHext 7.4, and pHint 6.4 (open inverted triangles), 7.35 (closed circles), or 8.4 (open triangles). Straight lines through τblock −1 data represent fits to the data with linear functions with slopes of 12.6, 3.4, and 0.9 s−1μM−1, and y intercepts of 10.4, 10.7, and 10.7 μM to data recorded at pHint 6.4, 7.4, and 8.4, respectively. Symbols and associated error bars in D and E represent means ± SEM for three (control) and five cells (rest of the conditions). (F) logIC50 plotted as a function of the difference between pHext and pHint. Closed circles and associated error bars represent means ± SD of individual fits to cells shown in D, plus four cells tested at pHext//pHint 7.1//7.7, five cells at 7.1//6.8, three cells at 7.6//6.8, and five cells at 7.1//8. Straight line through symbols represents the best fit of a linear function with slope −0.86, and y intercept 0.43, to the data. The dotted line has the same y intercept, but a slope of −1.
F<sc>igure</sc> 9.
Figure 9.
pH dependence of astemizole block of hEag1 channels. (A) Dose–response plots for astemizole at pHext//pHint relations of 7.4//7.35 (open circles), 6.4//7.35 (closed inverted triangles), 8.4//7.35 (closed upright triangles), 7.4//6.4 (open inverted triangles), and 7.4//8.4 (open upright triangles). The steady-state fraction of channels blocked was calculated as in Fig. 1 D. The data were fitted using the Hill equation (solid lines, see text for average IC50). Symbols and associated error bars represent means ± SEM for three (control and pHext 8.4), five (pHext 6.4 and pHint 8.4), and ten cells (pHint 6.4). (B) Time course of block onset and washout in cells recorded with pHext 7.4 and pHint 6.4 (open inverted triangles) or 8.4 (open triangles). The recording protocol consisted of a 1-s test pulse to 80 mV applied every 30 s. The fraction of channels blocked was calculated from the mean current recorded during the last 20 ms of the test pulse. During the time indicated by the solid line, cells were exposed to 250 nM (pHint 6.4) or 5 μM astemizole (pHint 8.4). Solid lines through symbols represent the best fit of single exponential functions (see text for time constants) to the experimental data during drug application and washout. Symbols and associated error bars represent means ± SEM for three cells tested in each condition. (C and D) logIC50 (C) and log(IC50)2 (D) plotted as a function of the pH difference between pHext and pHint. Closed circles and associated error bars represent means ± SD of individual fits of cells shown in A. Straight line through symbols represents the best fit of linear functions with slopes and y intercepts given in the text to the data. The dotted lines have the same y intercepts, but slopes of −1. (E) Superimposed hEag1 current recorded in the same inside-out patch during 1-s depolarizations to 80 mV from a holding potential of −70 mV in the absence (top) or presence (bottom) of a 500 nM astemizole concentration at the indicated bath pHs. Each current trace presented is the average of three recordings at each condition. (F) Inside-out current traces in the presence of astemizole were normalized dividing them point by point by the respective preapplication traces. Traces shown represent the average current ratios from five patches recorded as in E.
F<sc>igure</sc> 10.
Figure 10.
Block of hEag1 channels by imipramine, N-methyl-imipramine, and astemizole in cell-free patches. (A and B) Successive 6-s recordings at 80 mV in the same inside-out (A) or outside-out patches (B), respectively. At the time indicated by the solid line, the substances where applied during 2.5 s at the indicated concentrations. The bath solution had, in both cases, a pH of 6.0, while the pipette solution had a pH of 7.4. (C and D) Effect of application of N-methyl-imipramine on representative inside-out (C) and outside-out (D) patches, at both external and internal pH of 7.4.

Similar articles

Cited by

References

    1. Albert, A. 1952. Ionization, pH and biological activity. Pharmacol. Rev. 4:136–167. - PubMed
    1. Ariëns, E.J., and A.M. Simonis. 1963. pH and drug action. Arch. Int. Pharmacodyn. Ther. 141:309–330. - PubMed
    1. Armstrong, C.M. 1966. Time course of TEA+-induced anomalous rectification in squid giant axons. J. Gen. Physiol. 50:491–503. - PMC - PubMed
    1. Armstrong, C.M. 1969. Inactivation of the potassium conductance and related phenomena caused by quaternary ammonium ion injection in squid axons. J. Gen. Physiol. 54:553–575. - PMC - PubMed
    1. Armstrong, C.M. 1971. Interaction of tetraethylammonium ion derivates with potassium channels of giant axons. J. Gen. Physiol. 58:413–437. - PMC - PubMed

Publication types

MeSH terms