. 2004 Sep 20;200(6):761-70.
doi: 10.1084/jem.20041196. Epub 2004 Sep 13.

Primary HIV-1 infection is associated with preferential depletion of CD4+ T lymphocytes from effector sites in the gastrointestinal tract

Affiliations

Primary HIV-1 infection is associated with preferential depletion of CD4+ T lymphocytes from effector sites in the gastrointestinal tract

Saurabh Mehandru et al. J Exp Med. .

Abstract

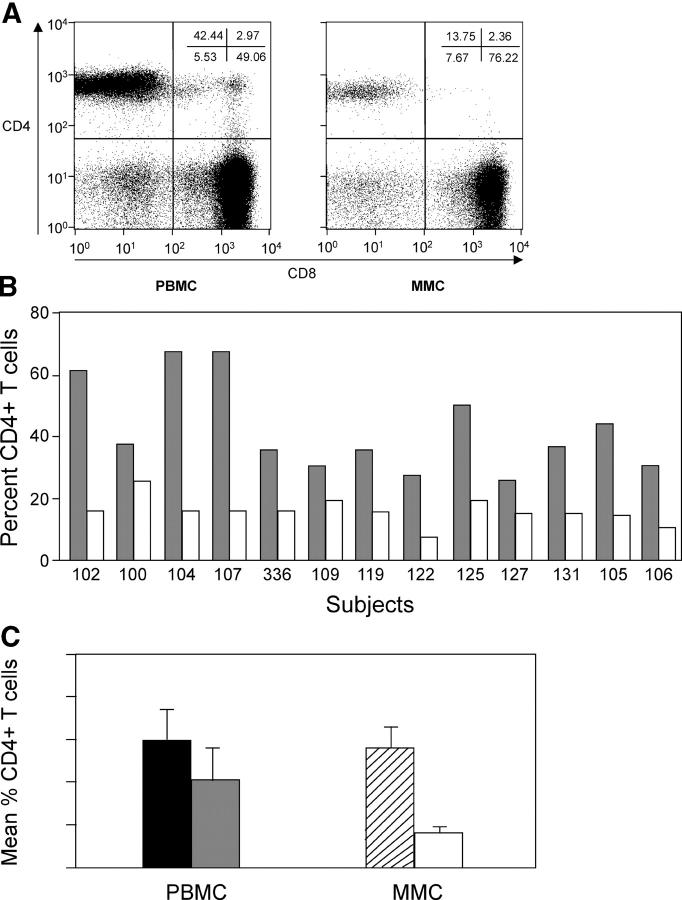
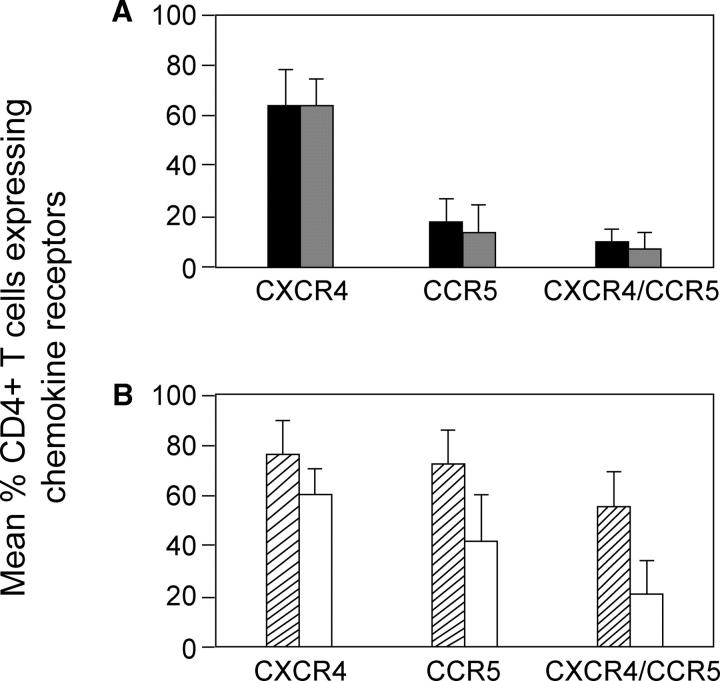
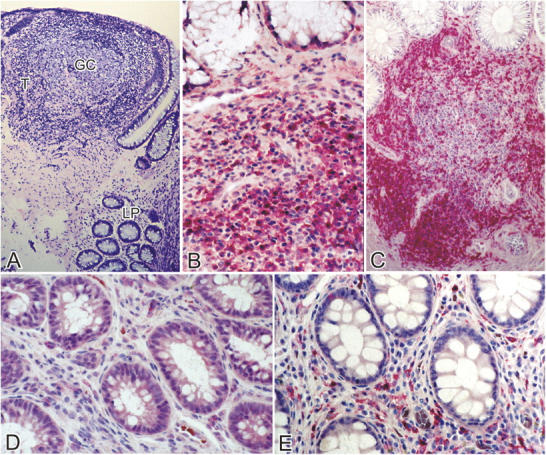
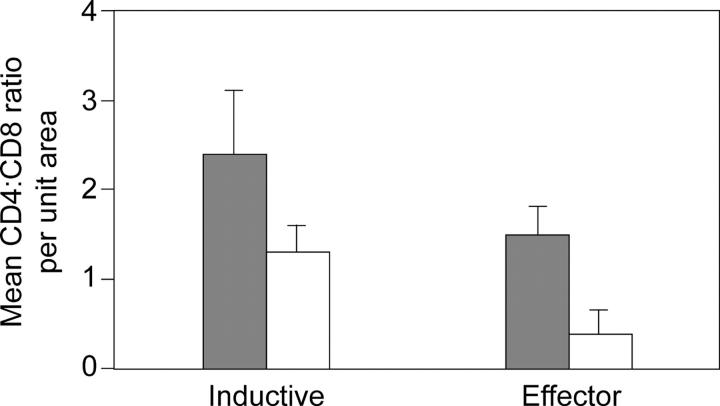
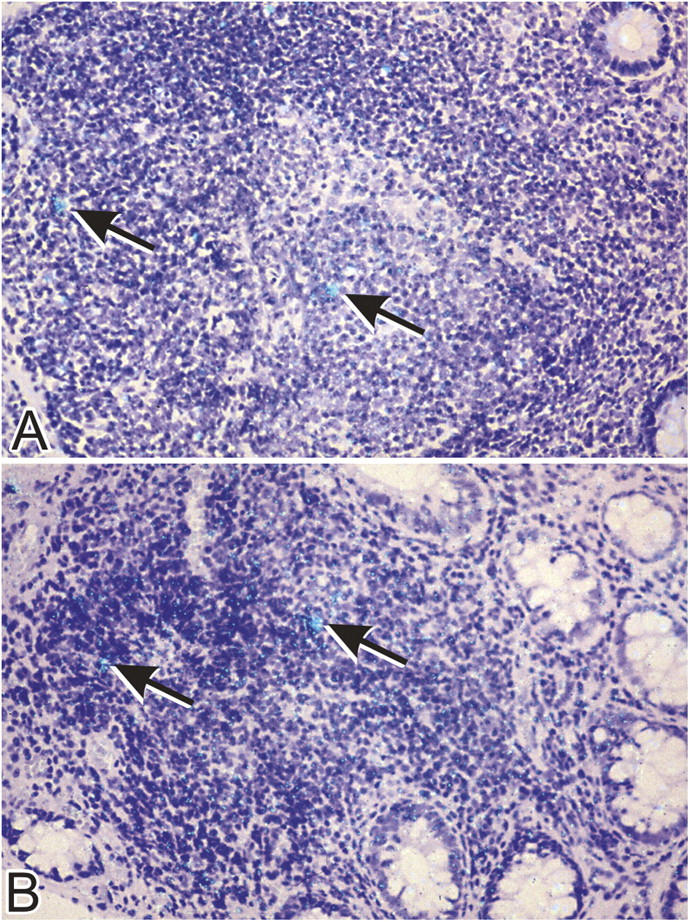
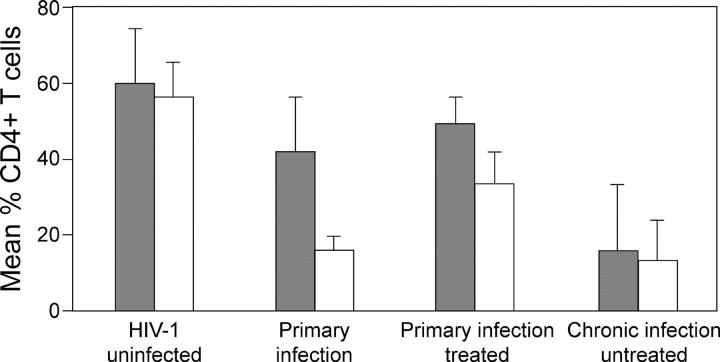
Given its population of CCR5-expressing, immunologically activated CD4(+) T cells, the gastrointestinal (GI) mucosa is uniquely susceptible to human immunodeficiency virus (HIV)-1 infection. We undertook this study to assess whether a preferential depletion of mucosal CD4(+) T cells would be observed in HIV-1-infected subjects during the primary infection period, to examine the anatomic subcompartment from which these cells are depleted, and to examine whether suppressive highly active antiretroviral therapy could result in complete immune reconstitution in the mucosal compartment. Our results demonstrate that a significant and preferential depletion of mucosal CD4(+) T cells compared with peripheral blood CD4(+) T cells is seen during primary HIV-1 infection. CD4(+) T cell loss predominated in the effector subcompartment of the GI mucosa, in distinction to the inductive compartment, where HIV-1 RNA was present. Cross-sectional analysis of a cohort of primary HIV-1 infection subjects showed that although chronic suppression of HIV-1 permits near-complete immune recovery of the peripheral blood CD4(+) T cell population, a significantly greater CD4(+) T cell loss remains in the GI mucosa, despite up to 5 yr of fully suppressive therapy. Given the importance of the mucosal compartment in HIV-1 pathogenesis, further study to elucidate the significance of the changes observed here is critical.


Figures

Figure 1.
Figure 1.
CD4+ T cells are preferentially depleted in the GI tract in acute and early HIV-1 infection. PBMCs and MMCs from the rectosigmoid region from group 1, acute and early HIV-1 infection subjects (n = 13), and HIV-1–uninfected controls (n = 10) were analyzed by flow cytometry. CD3+ gated lymphocytes were analyzed for the expression of CD4 and CD8. (A) A representative flow plot from subject 105 is depicted. CD8+ T cells are shown on the x axis and CD4+ T cells are shown on the y axis. (B) Comparison of CD4+ T cells in the blood and GI tract of all 13 group 1 primary infection subjects. The percent of CD4+ T cells is shown in PBMCs (gray) and MMCs (white) per study subject. (C) Comparison of the mean percent of CD4+ T cells in the PBMCs of HIV-1–uninfected controls (black bar) and group1 subjects (gray bar), and MMCs of HIV-1–uninfected controls (hatched bar) and group 1 subjects (white bar).
Figure 2.
Figure 2.
CD4+ T cells expressing CCR5 are preferentially depleted from the GI tract in acute and early HIV-1 infection. PBMCs (A) and MMCs (B) from the rectosigmoid region from individuals with acute and early HIV-1 infection (group 1, n = 13) and HIV-1–uninfected controls (n = 10) were analyzed by flow cytometry. CD3+/CD4+ gated lymphocytes were analyzed for the expression of CXCR4, CCR5, or CCR5/CXCR4. HIV-1–uninfected PBMCs (black bars), group 1 PBMCs (gray bars), HIV-1–uninfected MMCs (hatched bars), and group 1 MMCs (white bars) are shown. Mean percent of CD4+ T cells expressing chemokine receptors are depicted on the y axis and chemokine coreceptors CXCR4, CCR5, and CCR5/CXCR4 are grouped on the x axis.
Figure 3.
Figure 3.
Effector sites (lamina propria) of the GI tract show the most pronounced CD4+ T cell depletion in acute and early HIV-1 infection. Immunohistochemical characterization of the effector and inductive sites in the rectal biopsies. Using a PC-based image analysis system (KS 4000; Kontron), a standard area was set by the image analyzer. For the lamina propria, a total of 10–15 consecutive nonoverlapping fields were analyzed for each staining. For the GALT, two to five representative areas were chosen. (A) At a magnification of 25, a Giemsa-stained section is shown depicting a lymphoid nodule (inductive site) where the germinal center (GC) and T cell zone (T) are indicated. The effector compartment represented by the lamina propria (LP) is seen in the lower part of the section. (B and C) The inductive sites are densely populated with CD4+ T cells (stained red) in both group 1 (B) and HIV-1–uninfected (C) subjects. A magnification of 100. (D and E) Effector sites in acute and early HIV-1 infection (D) show significant depletion of CD4+ T cells (stained red) compared with HIV-1–uninfected controls (E). A magnification of 100. (F) In the inductive and effector compartments, the mean of CD4+ and CD8+ T cells per unit area was determined and the CD4/CD8 ratio was calculated. A comparison of the mean CD4/CD8 ratio (represented on the y axis) between HIV-1–uninfected (gray bars) and group 1 subjects (white bars) is shown.
Figure 3.
Figure 3.
Effector sites (lamina propria) of the GI tract show the most pronounced CD4+ T cell depletion in acute and early HIV-1 infection. Immunohistochemical characterization of the effector and inductive sites in the rectal biopsies. Using a PC-based image analysis system (KS 4000; Kontron), a standard area was set by the image analyzer. For the lamina propria, a total of 10–15 consecutive nonoverlapping fields were analyzed for each staining. For the GALT, two to five representative areas were chosen. (A) At a magnification of 25, a Giemsa-stained section is shown depicting a lymphoid nodule (inductive site) where the germinal center (GC) and T cell zone (T) are indicated. The effector compartment represented by the lamina propria (LP) is seen in the lower part of the section. (B and C) The inductive sites are densely populated with CD4+ T cells (stained red) in both group 1 (B) and HIV-1–uninfected (C) subjects. A magnification of 100. (D and E) Effector sites in acute and early HIV-1 infection (D) show significant depletion of CD4+ T cells (stained red) compared with HIV-1–uninfected controls (E). A magnification of 100. (F) In the inductive and effector compartments, the mean of CD4+ and CD8+ T cells per unit area was determined and the CD4/CD8 ratio was calculated. A comparison of the mean CD4/CD8 ratio (represented on the y axis) between HIV-1–uninfected (gray bars) and group 1 subjects (white bars) is shown.
Figure 4.
Figure 4.
HIV-1 RNA is localized in the organized lymphoid follicles of the GI tract in subjects with acute and early HIV-1 infection. In situ hybridization was performed using a 35S-labeled, single stranded antisense RNA probe as described in Materials and Methods. Cells expressing HIV-1 RNA (arrows) are present in the germinal center and T cell zone. A magnification of 40.
Figure 5.
Figure 5.
Prolonged HAART results in only partial reconstitution of the GI tract CD4+ T cells. PBMCs and MMCs from the rectosigmoid region from HIV-1–uninfected individuals (n = 10), subjects with acute and early HIV-1 infection (n = 13), subjects with HIV-1 infection treated during the primary infection stage (n = 8), and chronically infected HIV-1–untreated subjects (n = 8) were analyzed by flow cytometry. The mean percent of CD4+ T cells is shown in PBMCs (gray bars) and MMCs (white bars) per study group.

Similar articles

Cited by

References

    1. Cerf-Bensussan, N., and D. Guy-Grand. 1991. Intestinal intraepithelial lymphocytes. Gastroenterol. Clin. North Am. 20:549–576. - PubMed
    1. Smit-McBride, Z., J.J. Mattapallil, M. McChesney, D. Ferrick, and S. Dandekar. 1998. Gastrointestinal T lymphocytes retain high potential for cytokine responses but have severe CD4(+) T-cell depletion at all stages of simian immunodeficiency virus infection compared to peripheral lymphocytes. J. Virol. 72:6646–6656. - PMC - PubMed
    1. Veazey, R.S., K.G. Mansfield, I.C. Tham, A.C. Carville, D.E. Shvetz, A.E. Forand, and A.A. Lackner. 2000. Dynamics of CCR5 expression by CD4(+) T cells in lymphoid tissues during simian immunodeficiency virus infection. J. Virol. 74:11001–11007. - PMC - PubMed
    1. Mellors, J.W., C.R. Rinaldo Jr., P. Gupta, R.M. White, J.A. Todd, and L.A. Kingsley. 1996. Prognosis in HIV-1 infection predicted by the quantity of virus in plasma. Science. 272:1167–1170. - PubMed
    1. Nabel, G., and D. Baltimore. 1987. An inducible transcription factor activates expression of human immunodeficiency virus in T cells. Nature. 326:711–713. - PubMed

Publication types

MeSH terms

Substances