. 2004 Oct;78(19):10507-15.
doi: 10.1128/JVI.78.19.10507-10515.2004.

Dual role of prostratin in inhibition of infection and reactivation of human immunodeficiency virus from latency in primary blood lymphocytes and lymphoid tissue

Affiliations

Dual role of prostratin in inhibition of infection and reactivation of human immunodeficiency virus from latency in primary blood lymphocytes and lymphoid tissue

Angélique Biancotto et al. J Virol. 2004 Oct.

Abstract

To design strategies to purge latent reservoirs of human immunodeficiency virus type 1 (HIV-1), we investigated mechanisms by which a non-tumor-promoting phorbol ester, prostratin, inhibits infection of CD4(+) T lymphocytes and at the same time reactivates virus from latency. CD4(+) T lymphocytes from primary blood mononuclear cells (PBMC) and in blocks of human lymphoid tissue were stimulated with prostratin and infected with HIV-1 to investigate the effects of prostratin on cellular susceptibility to the virus. The capacity of prostratin to reactivate HIV from latency was tested in CD4(+) T cells harboring preintegrated and integrated latent provirus. Prostratin stimulated CD4(+) T cells in an aberrant way. It induced expression of the activation markers CD25 and CD69 but inhibited cell cycling. HIV-1 uptake was reduced in prostratin-stimulated CD4(+) T PBMC and tissues in a manner consistent with a downregulation of CD4 and CXCR4 receptors in these systems. At the postentry level, prostratin inhibited completion of reverse transcription of the viral genome in lymphoid tissue. However, prostratin facilitated integration of the reverse-transcribed HIV-1 genome in nondividing CD4(+) T cells and facilitated expression of already integrated HIV-1, including latent forms. Thus, while stimulation with prostratin restricts susceptibility of primary resting CD4(+) T cells to HIV infection at the virus cell-entry level and at the reverse transcription level, it efficiently reactivates HIV-1 from pre- and postintegration latency in resting CD4(+) T cells.


Figures
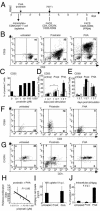
FIG. 1.
FIG. 1.
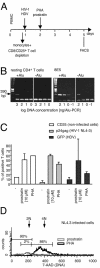
HIV-1 infection of prostratin-treated PBMC. PBMC depleted of monocytes by overnight adherence to plastic and depleted of CD8+ and of CD25+/CD69+/HLA-DR+ cells by monoclonal antibody were stimulated either with 10 μM prostratin (Prost) or with PHA (2 μg/ml) and infected with HIV-1 NL4-3 3 days poststimulation. (A) Time schedule of cell culture and HIV-1 challenge. The fluorescence-activated cell sorter and cell proliferation analyses whose results are shown in panels B, C, F, G, and H were performed at 3 days poststimulation. FACS, fluorescence-activated cell sorter. (B to F) Induction of CD25 (B, C, and D) and of CD69 (E and F). (D to E) Kinetics of CD25 (D) and CD69 (E) expression in prostratin- and PHA-stimulated cultures. The asterisk denotes statistical significance (P < 0.02). untreat, untreated. (G) The effect of prostratin on the expression of CD4 and CXCR4. (H) The effect of prostratin on the relative proliferation index in PBMC activated with PHA (2 μg/ml) (n = 4). The relative proliferation index was calculated as the ratio of incorporation of [3H]thymidine into PHA- and prostratin-treated samples to that in controls treated only with PHA. (I to J) The effects of prostratin on the cellular uptake of HIV-1 (I) and on the number ofproductively infected cells (J). To measure the HIV-1 uptake, cells treated or not treated with prostratin were exposed to HIV-1 for 4 h at 37 or 4°C, and viral entry was evaluated by quantification by enzyme-linked immunosorbent assay of the difference in intracellular p24gag levels at these temperatures. To measure the amounts of productive infection, cells treated or not treated with prostratin were exposed to HIV-1 for 4 days, and the numbers of infected cells were evaluated by means of flow cytometry after staining for intracellular p24gag. Typical dual-parameter plots from three experiments with indistinguishable results are shown in panels B, F, and G. Numbers displayed in each quadrant in these panels are percentages of positive cells. The results shown are the means of eight different experiments with PBMC from three donors.
FIG. 2.
FIG. 2.
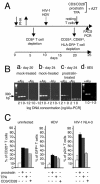
Effect of prostratin on resting CD4+ T cells infected with HIV-1. PBMC were depleted of monocytes, CD8+ cells, and CD25+/CD69+/HLA-DR+ cells and were inoculated with HIV-1 (approximately 1 TCID50 per cell) or HDV (approximately 5 TCID50 per cell) on day 1 of culture. These cells were reactivated with 10 μM prostratin, with PHA (2 μg/ml), or with soluble anti-CD3/CD28 monoclonal antibodies (1 μg/ml) in the presence of 10 μM AZT and 5 μM nevirapine on day 1 postinfection. (A) Time schedule of the experiments. FACS, fluorescence-activated cell sorter. (B) Alu PCR of 10-fold serial dilutions of genomic DNA extracted from resting treated CD4+ T cells inoculated with HIV-1 and from control cell line 8E5. Nested PCR amplifications were conducted with the primer pairs as follows: a first round with primer pair Alu and L1 (L1 is an antisense primer localized in LTR) (+Alu) and a control round in which the forward Alu primer was omitted (−Alu) were followed by a second round of PCR with HIV-1-specific primers from the U3 part of the HIV-1 LTR. Amplification products were run on agarose gels and visualized by means of ethidium bromide staining. (C) Percentages of cells positive for CD25 (open bars), p24gag (light-gray-shaded bars), and GFP (black bars);means of six different experiments on PBMC from three different donors are shown. (D) Effect of prostratin on cell cycling of resting CD4+ T cells infected with HIV-1 NL4-3. DNA content was determined by staining with 7ADD. Nonactivated or PHA-activated uninfected PBMC depleted of monocytes and CD8+ cells were used as standards for 2 and 4 N DNA content. Horizontal bars aligned with the labels of untreated, prostratin-treated, and PHA-treated cells indicate the limits of the areas of 2 and 4 N cells.
FIG. 3.
FIG. 3.
Effect of prostratin on resting CD4+ T cells infected with HIV-1. PHA-activated PBMC depleted of monocytes, of CD8+ cells, and of CD25+/CD69+/HLA-DR+ cells were inoculated with HIV-1 or HDV on day 10 postactivation. After their return to resting phase (20 days postinfection), residual CD25+/CD69+/HLA-DR+ cells were removed and the remaining cells were treated with 10 μM prostratin, TPA (100 nM), or soluble anti-CD3/CD28 monoclonal antibodies (1 μg/ml) in the presence of 10 μM AZT. Cells were analyzed by means of fluorescence-activated cell sorter (FACS) analysis or Alu PCR on day 3 after application of prostratin. (A) Time schedule of the experiment. (B) Alu PCR of 10-fold serial dilutions of genomic DNA extracted from mock-treated CD4+ T cells (lanes a and b) 20 (lane a) or 24 (lane b) days after PHA stimulation or from prostratin-treated cells at day 24 (lane c). Nested PCR amplifications were conducted with the following primer pairs: a first round with primer pair Alu and L1 (L1 is an antisense primer localized in LTR) (+Alu) and a control round from which the forward Alu primer was omitted (−Alu) were followed by a second round of PCR with HIV-1-specific primers from the U3 part of the HIV-1 LTR. Amplification products were run on agarose gels and visualized by means of ethidium bromide staining. (C) Percentages of noninfected CD25+ cells, HDV-inoculated GFP+ cells, and HIV-1-infected p24gag+ cells that were left nonreactivated (control) (open bars) or were activated with prostratin (black bars), TPA (dark-gray-shaded bars), or CD3/CD28 (light-gray-shaded bars). The means of at least 4 experiments (14 experiments for prostratin-activated cells) are shown.
FIG. 4.
FIG. 4.
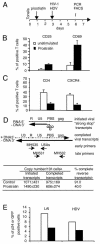
HIV-1 infection of prostratin-treated lymphoid tissue. Human tonsils (54 to 72 blocks) from each of four donors were stimulated with prostratin and were inoculated with HIV-1 LAI or with HDV 2 days poststimulation. Cells were analyzed by means of flow cytometry and PCR on day 3 postinfection. Infected and control uninfected cultures were gated on CD3+ cells. The percentages of p24gag+/CD3+ T cells were corrected for background (p24gag+/CD3+ T-cell counts detected in mock-infected blocks from the same donor). (A) Time schedule of the experiment. (B) Effect of prostratin on the expression of the cell surface activation markers CD25 and CD69 on tissue T cells. (C) Effects of prostratin on the expression of the HIV-1 receptors CD4 and CXCR4 on tissue T cells. (D) Effect of prostratin on completion of reverse transcription in tonsillar tissue infected with HIV-1 LAI 3 days after stimulation, as determined from real-time PCR 3 days postinfection. Second column from the left: viral copy numbers and cell equivalents were determined by comparison with the known quantity of pNL4.3 and with actin standards, respectively. Third column: the copy numbers of initiated transcripts were assessed as the difference of copy numbers amplified by early and late primers. Note that early primers amplify both initiated and completed viral transcripts. Fourth column: the percentage of complete reverse transcripts is calculated as the ratio of completed to initiated transcripts × 100. R, short repeat. (E) Effect of prostratin on the expression of HIV-1 and HDV in tissue T cells as determined with p24gag and GFP, respectively.
FIG. 5.
FIG. 5.
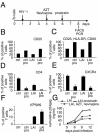
Effect of prostratin on lymphoid tissue infected with HIV-1. Human tonsils (54 to 72 blocks) from each of five donors infected ex vivo with HIV-1 NL4-3 were treated with 10 μM AZT and 5 μM nevirapine on day 3 postinfection and stimulated with 10 μM prostratin (pro) on day 5 postinfection. Cells were analyzed by means of flow cytometry and PCR on day 7 postinfection. Ctrl, control. (A) Time schedule of the experiment. FACS, fluorescence-activated cell sorter. (B to E) Percentages of T cells in HIV-1-infected and prostratin-treated human lymphoid tissue expressing the following markers: CD25 (B); CD25, CD69, and HLA-DR (C); CD4 (D); CXCR4 (E); p24gag (F); and p24gag in culture medium (G). Infected and control uninfected cultures were gated on CD3+ cells. The percentages of p24+/CD3+ T cells were corrected for background (p24+/CD3+ T-cell counts detected in mock-infected blocks from the same donor).

Similar articles

Cited by

References

    1. Adachi, A., H. E. Gendelman, S. Koenig, T. Folks, R. Willey, A. Rabson, and M. A. Martin. 1986. Production of acquired immunodeficiency syndrome-associated retrovirus in human and nonhuman cells transfected with an infectious molecular clone. J. Virol. 59:284-291. - PMC - PubMed
    1. Brooks, D. G., D. H. Hamer, P. A. Arlen, L. Gao, G. Bristol, C. M. Kitchen, E. A. Berger, and J. A. Zack. 2003. Molecular characterization, reactivation, and depletion of latent HIV. Immunity 19:413-423. - PubMed
    1. Bukrinsky, M. I., T. L. Stanwick, M. P. Dempsey, and M. Stevenson. 1991. Quiescent T lymphocytes as an inducible virus reservoir in HIV-1 infection. Science 254:423-427. - PMC - PubMed
    1. Butler, S. L., M. S. Hansen, and F. D. Bushman. 2001. A quantitative assay for HIV DNA integration in vivo. Nat. Med. 7:631-634. - PubMed
    1. Chun, T. W., L. Carruth, D. Finzi, X. Shen, J. A. DiGiuseppe, H. Taylor, M. Hermankova, K. Chadwick, J. Margolick, T. C. Quinn, Y. H. Kuo, R. Brookmeyer, M. A. Zeiger, P. Barditch-Crovo, and R. F. Siliciano. 1997. Quantification of latent tissue reservoirs and total body viral load in HIV-1 infection. Nature 387:183-188. - PubMed

Publication types

MeSH terms