. 2004 Oct;24(19):8586-99.
doi: 10.1128/MCB.24.19.8586-8599.2004.

Epidermal growth factor receptor-dependent regulation of integrin-mediated signaling and cell cycle entry in epithelial cells

Affiliations

Epidermal growth factor receptor-dependent regulation of integrin-mediated signaling and cell cycle entry in epithelial cells

Heather M Bill et al. Mol Cell Biol. 2004 Oct.

Abstract

Integrin-mediated adhesion of epithelial cells to extracellular matrix (ECM) proteins induces prolonged tyrosine phosphorylation and partial activation of epidermal growth factor receptor (EGFR) in an integrin-dependent and EGFR ligand-independent manner. Integrin-mediated activation of EGFR in epithelial cells is required for multiple signal transduction events previously shown to be induced by cell adhesion to matrix proteins, including tyrosine phosphorylation of Shc, Cbl, and phospholipase Cgamma, and activation of the Ras/Erk and phosphatidylinositol 3'-kinase/Akt signaling pathways. In contrast, activation of focal adhesion kinase, Src, and protein kinase C, adhesion to matrix proteins, cell spreading, migration, and actin cytoskeletal rearrangements are induced independently of EGFR kinase activity. The ability of integrins to induce the activation of EGFR and its subsequent regulation of Erk and Akt activation permitted adhesion-dependent induction of cyclin D1 and p21, Rb phosphorylation, and activation of cdk4 in epithelial cells in the absence of exogenous growth factors. Adhesion of epithelial cells to the ECM failed to efficiently induce degradation of p27, to induce cdk2 activity, or to induce Myc and cyclin A synthesis; subsequently, cells did not progress into S phase. Treatment of ECM-adherent cells with EGF, or overexpression of EGFR or Myc, resulted in restoration of late-G(1) cell cycle events and progression into S phase. These results indicate that partial activation of EGFR by integrin receptors plays an important role in mediating events triggered by epithelial cell attachment to ECM; EGFR is necessary for activation of multiple integrin-induced signaling enzymes and sufficient for early events in G(1) cell cycle progression. Furthermore, these findings suggest that EGFR or Myc overexpression may provoke ligand-independent proliferation in matrix-attached cells in vivo and could contribute to carcinoma development.


Figures
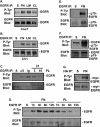
FIG. 1.
FIG. 1.
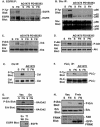
FN-induced phosphorylation of EGFR. (A and B) Cos7 (A) or CV1 (B) cells were either held in suspension (S) or plated on FN, laminin (LM), or collagen I (CL) for 20 min. (C) CV1 cells were either held in suspension or treated with 10 μg of immunoglobulin G/ml (Ig), 10 μg of an anti-α5 antibody/ml (α5), or 5 or 10 μg of an anti-β1 integrin antibody/ml (β1) for 1 h. Cells were plated on polylysine (PL) and incubated for 30 min. (D) CV1 cells were either held in suspension or plated on FN or polylysine for the indicated times. EGFR phosphorylation in EGFR immunoprecipitates was measured by immunoblotting with an anti-phosphotyrosine monoclonal antibody (P-Tyr Blot). Total levels of EGFR in the immunoprecipitates were analyzed by immunoblotting with an anti-EGFR antibody (EGFR Blot). (E through G) Rat1 cells stably expressing the p75-EGFR chimera (the p75 extracellular and transmembrane domains fused to the cytoplasmic domain of EGFR) (E) or Cos7 cells transiently transfected with either 0.5 μg of pML-p75.EGFR.F2.HA, encoding the p75-EGFR chimera (F), or 0.1 μg of pML-EGFR-F1-HA, encoding a myristoylated EGFR cytoplasmic domain (myr-EGFR) (G), were either held in suspension or plated on FN for 20 min. Levels of tyrosine phosphorylation of the chimeras were analyzed by immunoblotting of EGFR or HA immunoprecipitates with anti-phosphotyrosine antibodies. Total levels of p75-EGFR or myr-EGFR in the immunoprecipitates were measured by immunoblotting with anti-EGFR antibodies. (Note that in panel F, endogenous levels of EGFR are also shown.) (H) Control cells expressing endogenous levels of EGFR (Endog) or EGFR-overexpressing cells (EGFR1) were either placed in suspension, plated on FN for 30 min, or stimulated with 2 ng of EGF/ml for 5 min. EGFR was immunoprecipitated from cell extracts, and total levels of tyrosine phosphorylation (P-Tyr Blot) or phosphorylation of one of six different tyrosines (Y845, Y992, Y1068, Y1086, Y1148, or Y1173) was monitored by immunoblotting with anti-phospho-EGFR antibodies. Total levels of EGFR in the immunoprecipitates were analyzed by immunoblotting with an anti-EGFR antibody. Digital images were quantified by using ScanImage software (Scion Corp). The fold difference in tyrosine phosphorylation between FN- and EGF-treated cells is given below each set of panels.
FIG. 1.
FIG. 1.
FN-induced phosphorylation of EGFR. (A and B) Cos7 (A) or CV1 (B) cells were either held in suspension (S) or plated on FN, laminin (LM), or collagen I (CL) for 20 min. (C) CV1 cells were either held in suspension or treated with 10 μg of immunoglobulin G/ml (Ig), 10 μg of an anti-α5 antibody/ml (α5), or 5 or 10 μg of an anti-β1 integrin antibody/ml (β1) for 1 h. Cells were plated on polylysine (PL) and incubated for 30 min. (D) CV1 cells were either held in suspension or plated on FN or polylysine for the indicated times. EGFR phosphorylation in EGFR immunoprecipitates was measured by immunoblotting with an anti-phosphotyrosine monoclonal antibody (P-Tyr Blot). Total levels of EGFR in the immunoprecipitates were analyzed by immunoblotting with an anti-EGFR antibody (EGFR Blot). (E through G) Rat1 cells stably expressing the p75-EGFR chimera (the p75 extracellular and transmembrane domains fused to the cytoplasmic domain of EGFR) (E) or Cos7 cells transiently transfected with either 0.5 μg of pML-p75.EGFR.F2.HA, encoding the p75-EGFR chimera (F), or 0.1 μg of pML-EGFR-F1-HA, encoding a myristoylated EGFR cytoplasmic domain (myr-EGFR) (G), were either held in suspension or plated on FN for 20 min. Levels of tyrosine phosphorylation of the chimeras were analyzed by immunoblotting of EGFR or HA immunoprecipitates with anti-phosphotyrosine antibodies. Total levels of p75-EGFR or myr-EGFR in the immunoprecipitates were measured by immunoblotting with anti-EGFR antibodies. (Note that in panel F, endogenous levels of EGFR are also shown.) (H) Control cells expressing endogenous levels of EGFR (Endog) or EGFR-overexpressing cells (EGFR1) were either placed in suspension, plated on FN for 30 min, or stimulated with 2 ng of EGF/ml for 5 min. EGFR was immunoprecipitated from cell extracts, and total levels of tyrosine phosphorylation (P-Tyr Blot) or phosphorylation of one of six different tyrosines (Y845, Y992, Y1068, Y1086, Y1148, or Y1173) was monitored by immunoblotting with anti-phospho-EGFR antibodies. Total levels of EGFR in the immunoprecipitates were analyzed by immunoblotting with an anti-EGFR antibody. Digital images were quantified by using ScanImage software (Scion Corp). The fold difference in tyrosine phosphorylation between FN- and EGF-treated cells is given below each set of panels.
FIG. 2.
FIG. 2.
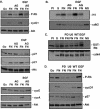
EGFR is required for FN-induced signaling events. Cos7 cells were placed in suspension (S), either left untreated or treated with 1 μM AG1478 or 0.5 μM PD168393, and plated on FN for 30 min. (A through F) EGFR (A), Shc (B), Erk (C), Akt (D), Cbl (E), and PLCγ (F) phosphorylation was analyzed by immunoblotting of EGFR, Shc, PLCγ, or Cbl immunoprecipitates with an anti-phosphotyrosine monoclonal antibody (P-Tyr Blot) or by immunoblotting of total-cell extracts with a phosphospecific antibody against Erk (P-Erk Blot) or Akt (P-Akt Blot). Total levels of EGFR, Shc, Erk, Akt, PLCγ, or Cbl in the immunoprecipitates or cell lysates were analyzed by immunoblotting with their respective antibodies (EGFR Blot, Shc Blot, Erk Blot, Akt Blot, PLCγ Blot, and Cbl Blot). (G) Cos7 cells were transfected with 0.2 μg of pSLV-HA-Erk2 and 1 μg of pDEST12.2-dnEGFR (Dn) or 1 μg of vector (Vec). Forty-eight hours later, cells were harvested and either placed in suspension or plated on FN. The level of Erk activation was measured by immunoblotting of HA immunoprecipitates with an anti-P-Erk antibody. Total levels of Erk2 were measured by immunoblotting with an anti-Erk antibody. The level of dnEGFR expressed (Tf Dn) compared to endogenous EGFR expression (En Wt) was measured by immunoblotting cell lysates with an anti-EGFR antibody. (H) CV1 cells were infected with a virus containing an empty pLPCX vector (Vec) or a virus expressing GFP-FRNK. Erk activation in the vector- or GFP-FRNK-expressing cells was monitored in cell lysates with a phosphospecific anti-Erk antibody. Total levels of Erk in the immunoprecipitates were analyzed by immunoblotting with anti-Erk antibodies. Levels of GFP-FRNK expression were monitored by immunoblotting with an anti-FRNK antibody. Levels of endogenous FAK are also shown.
FIG. 3.
FIG. 3.
EGFR is not required for all FN-induced signaling events. Cos7 cells were placed in suspension (S), either left untreated or treated with 1 μM AG1478 or 0.5 μM PD168393, and plated on FN. (A) Tyrosine phosphorylation of FAK was analyzed by immunoblotting of FAK immunoprecipitates with an anti-phosphotyrosine monoclonal antibody (P-Tyr Blot). Total levels of FAK in the immunoprecipitates were monitored by immunoblotting with an anti-FAK monoclonal antibody (FAK Blot). (B) Src activation was measured by immunoblotting of Src immunoprecipitates with an anti-phospho-Src antibody (Y-416 Blot), and total levels of Src in the immunoprecipitates were analyzed by immunoblotting with the anti-Src monoclonal antibody 327 (Src Blot). (C) Following adhesion, Cos7 cells were fractionated into soluble cytoplasmic (Su) and detergent-soluble pellet (Pe) fractions, and the level of each PKC isoform in each fraction was analyzed by immunoblotting with specific anti-PKC antibodies as indicated (PKC Blots). (D) Tyrosine phosphorylation of PKCδ was analyzed by immunoblotting of PKCδ immunoprecipitates of the cytoplasmic and detergent-soluble fractions (P-Tyr Blot). Total levels of PKCδ in the immunoprecipitates were monitored by immunoblotting with an anti-PKCδ monoclonal antibody (PKCδ Blot). Note that membrane-associated PKCδ migrates more slowly in gels due to phosphorylation. (E) Model depicting the EGFR dependence of a subset of integrin-mediated signaling events, specifically Cbl, PLCγ, Shc, Erk, and Akt. Also shown is the EGFR independence of Src, FAK, and PKC activation. Integrin activation of FAK is dependent on actin polymerization (data not shown).
FIG. 3.
FIG. 3.
EGFR is not required for all FN-induced signaling events. Cos7 cells were placed in suspension (S), either left untreated or treated with 1 μM AG1478 or 0.5 μM PD168393, and plated on FN. (A) Tyrosine phosphorylation of FAK was analyzed by immunoblotting of FAK immunoprecipitates with an anti-phosphotyrosine monoclonal antibody (P-Tyr Blot). Total levels of FAK in the immunoprecipitates were monitored by immunoblotting with an anti-FAK monoclonal antibody (FAK Blot). (B) Src activation was measured by immunoblotting of Src immunoprecipitates with an anti-phospho-Src antibody (Y-416 Blot), and total levels of Src in the immunoprecipitates were analyzed by immunoblotting with the anti-Src monoclonal antibody 327 (Src Blot). (C) Following adhesion, Cos7 cells were fractionated into soluble cytoplasmic (Su) and detergent-soluble pellet (Pe) fractions, and the level of each PKC isoform in each fraction was analyzed by immunoblotting with specific anti-PKC antibodies as indicated (PKC Blots). (D) Tyrosine phosphorylation of PKCδ was analyzed by immunoblotting of PKCδ immunoprecipitates of the cytoplasmic and detergent-soluble fractions (P-Tyr Blot). Total levels of PKCδ in the immunoprecipitates were monitored by immunoblotting with an anti-PKCδ monoclonal antibody (PKCδ Blot). Note that membrane-associated PKCδ migrates more slowly in gels due to phosphorylation. (E) Model depicting the EGFR dependence of a subset of integrin-mediated signaling events, specifically Cbl, PLCγ, Shc, Erk, and Akt. Also shown is the EGFR independence of Src, FAK, and PKC activation. Integrin activation of FAK is dependent on actin polymerization (data not shown).
FIG. 4.
FIG. 4.
FN-induced EGFR activation is required for G1 cell cycle entry. (A and B) Adherent CV1 cells were serum starved for more than 48 h (Go), placed in suspension (S), left untreated or treated with 1 μM AG1478 (AG), and plated on FN in the absence (FN) or presence (EGF) of 40 ng of EGF/ml for 12 or 18 h. The time points selected were determined to be optimal for the events monitored in time course studies (data not shown). (A) The levels of cyclin D1 (cycD1), cyclin E (cycE), p27, p21, and Rb phosphorylation at Ser807/811 (P-Rb) at 12 h and the levels of cyclin A at 18 h were monitored by immunoblotting cell lysates with their respective antibodies. Total levels of Akt were monitored by immunoblotting as a control for total protein levels in the extracts. (B) cdk2 activity was measured by using in vitro kinase assays with histone H1 as a substrate and was quantified (1.74- ± 0.03-fold induction in the presence of FN only; 2.69- ± 0.01-fold in the presence of FN and EGF; n = 3). Preimmune (PI) and no-substrate (NS) controls were included. Total levels of kinase immunoprecipitated in the assays were monitored by immunoblotting with anti-cdk2 antibodies (cdk2). (C and D) CV1 cells were prepared as described above except that cells in suspension were pretreated with either 10 μM U0126 (U0), 100 nM wortmannin (WT), or 0.5 μM PD168393 (PD) 15 min prior to plating on FN. Results obtained after plating for 12 h are shown. (C) cdk4 kinase activity was monitored by an in vitro kinase assay by measuring phosphate incorporation into GST-Rb 12 h after plating on FN and was quantified (1.4- ± 0.2-fold in the presence or absence of EGF; n = 3). Preimmune and no-substrate controls were included. Total levels of kinase immunoprecipitated in the assays were monitored by immunoblotting with anti-cdk4 antibodies (cdk4). (D) Levels of cyclin D1, p27, and Rb phosphorylation at Ser807/811 were monitored by immunoblotting cell lysates with their respective antibodies. Total levels of Akt were monitored by immunoblotting as a control for total protein levels in the extracts.
FIG. 5.
FIG. 5.
Adhesion stimulates G1 cell cycle events in primary cells. Adherent primary prostate epithelial cells (A) or primary keratinocytes (B) were serum starved for 24 h, placed in suspension (S), left untreated or treated with 0.5 μM PD168393 (PD), and plated on FN in the absence (FN) or presence (EGF) of 40 ng of EGF/ml for 18 h. Levels of cyclin D1 (cycD1), cyclin A (cycA), p27, p21, and Rb phosphorylation (P-Rb) were monitored by immunoblotting cell lysates with their respective antibodies. Note that the levels of Rb phosphorylation are less than optimal due to the late time point selected for this assay. *, cyclin D1 is the lower band. Total levels of Akt were monitored by immunoblotting as a control for total protein levels in the extracts.
FIG. 6.
FIG. 6.
Adhesion is not sufficient for entry into S phase. (A) CV1 cells were plated onto FN-coated chamber slides in the absence (FN) or presence of 10% serum (FN + FBS), 200 ng of HGF/ml (FN + HGF), or 40 ng of EGF/ml (FN + EGF) and were allowed to adhere for 18 h. Two hours prior to fixation of cells, 10 μM BrdU was added to the medium. After fixation, cells were immunostained with anti-BrdU (green), and nuclei were counterstained with Hoechst 33258 (blue). The number of cells displaying nuclear BrdU staining was compared to the total number of cells in four fields, and the percent BrdU incorporation was calculated. A t test was used to determine significance. (B) Primary prostate epithelial cells were treated as described for panel A, except that 0.5 μM PD168393 (PD) was added to the cells 15 min prior to plating on FN. The level of BrdU incorporation was measured as described above.
FIG. 7.
FIG. 7.
EGFR and Myc overexpression rescues S phase. (A) CV1 cells were serum starved for 48 h and either left in suspension (S) or plated on FN in the absence (FN) or presence (EGF) of 40 ng of EGF/ml for the indicated times. The levels of cyclin D1 (cycD1), p27, cyclin A (cycA), and Rb phosphorylation at Thr821 (P-Rb T821) were monitored by immunoblotting with the respective antibodies. Total levels of Akt were monitored to control for total protein levels. (B) CV1 cells (CV) were infected with retroviruses expressing EGFR (R1, R5) or cyclin D1 (D1) or with an empty vector (V). Levels of EGFR and cyclin D1 expression were monitored by immunoblotting of whole-cell extracts with their respective antibodies after plating of cells on FN for 12 h. Levels of EGFR activation in virus-infected cells held in suspension or attached to FN were monitored by immunoblotting of EGFR immunoprecipitates with anti-phosphotyrosine antibodies (P-Tyr Blot). Total levels of EGFR were monitored by immunoblotting with an anti-EGFR antibody (EGFR Blot). *, the length of film exposure to enhanced chemiluminescence was 5 times less for EGFR-overexpressing cells than for other samples. (C) Adherent CV1 cells infected with retroviral vectors encoding either EGFR, cyclin D1, or no cDNA (Vector) were serum starved for 48 h and either placed in suspension or plated on FN for the indicated times. Levels of cyclin A and p27 were monitored by immunoblotting cell lysates with their respective antibodies. Rb phosphorylation at Thr821 was monitored by immunoblotting of cell lysates with phosphospecific antibodies. Total levels of Akt were monitored by immunoblotting as a control for total protein levels in the extracts. (D) CV1 cells were serum starved for 48 h and either placed in suspension or plated on FN in the absence or presence of 40 ng of EGF/ml for the indicated times. Adherent CV1 cells infected with retroviral vectors encoding EGFR or no cDNA were serum starved for 48 h and then either placed in suspension or plated on FN for the indicated times. Levels of Myc expression were monitored by immunoblotting of cell lysates with anti-Myc antibodies. Total levels of Akt were monitored by immunoblotting as a control for total protein levels in the extracts. (E) Adherent CV1 cells infected with retroviral vectors encoding either EGFR or no cDNA were serum starved for 48 h and then either placed in suspension or plated on FN for the indicated times. Levels of cyclin D1 were monitored by immunoblotting of cell lysates with anti-cyclin D1 antibodies. Erk and Akt activation was monitored by immunoblotting of cell lysates with phosphospecific antibodies (P-Erk, P-Akt). Total levels of Erk and Akt were monitored by immunoblotting as a control for total protein levels in the extracts (Erk, Akt). (F) CV1 cells were infected with a virus containing an empty vector or expressing MycER. Levels of MycER expression were monitored by immunoblotting with anti-Myc antibodies after plating on FN in the absence (FN) or presence (Tx) of 50 nM tamoxifen. Levels of p27 and cyclin A expression in cells in suspension or at the indicated times after plating on FN in the presence or absence of 50 nM tamoxifen were monitored by immunoblotting. Total levels of Akt were monitored by immunoblotting as a control for total protein levels in the extracts.
FIG. 7.
FIG. 7.
EGFR and Myc overexpression rescues S phase. (A) CV1 cells were serum starved for 48 h and either left in suspension (S) or plated on FN in the absence (FN) or presence (EGF) of 40 ng of EGF/ml for the indicated times. The levels of cyclin D1 (cycD1), p27, cyclin A (cycA), and Rb phosphorylation at Thr821 (P-Rb T821) were monitored by immunoblotting with the respective antibodies. Total levels of Akt were monitored to control for total protein levels. (B) CV1 cells (CV) were infected with retroviruses expressing EGFR (R1, R5) or cyclin D1 (D1) or with an empty vector (V). Levels of EGFR and cyclin D1 expression were monitored by immunoblotting of whole-cell extracts with their respective antibodies after plating of cells on FN for 12 h. Levels of EGFR activation in virus-infected cells held in suspension or attached to FN were monitored by immunoblotting of EGFR immunoprecipitates with anti-phosphotyrosine antibodies (P-Tyr Blot). Total levels of EGFR were monitored by immunoblotting with an anti-EGFR antibody (EGFR Blot). *, the length of film exposure to enhanced chemiluminescence was 5 times less for EGFR-overexpressing cells than for other samples. (C) Adherent CV1 cells infected with retroviral vectors encoding either EGFR, cyclin D1, or no cDNA (Vector) were serum starved for 48 h and either placed in suspension or plated on FN for the indicated times. Levels of cyclin A and p27 were monitored by immunoblotting cell lysates with their respective antibodies. Rb phosphorylation at Thr821 was monitored by immunoblotting of cell lysates with phosphospecific antibodies. Total levels of Akt were monitored by immunoblotting as a control for total protein levels in the extracts. (D) CV1 cells were serum starved for 48 h and either placed in suspension or plated on FN in the absence or presence of 40 ng of EGF/ml for the indicated times. Adherent CV1 cells infected with retroviral vectors encoding EGFR or no cDNA were serum starved for 48 h and then either placed in suspension or plated on FN for the indicated times. Levels of Myc expression were monitored by immunoblotting of cell lysates with anti-Myc antibodies. Total levels of Akt were monitored by immunoblotting as a control for total protein levels in the extracts. (E) Adherent CV1 cells infected with retroviral vectors encoding either EGFR or no cDNA were serum starved for 48 h and then either placed in suspension or plated on FN for the indicated times. Levels of cyclin D1 were monitored by immunoblotting of cell lysates with anti-cyclin D1 antibodies. Erk and Akt activation was monitored by immunoblotting of cell lysates with phosphospecific antibodies (P-Erk, P-Akt). Total levels of Erk and Akt were monitored by immunoblotting as a control for total protein levels in the extracts (Erk, Akt). (F) CV1 cells were infected with a virus containing an empty vector or expressing MycER. Levels of MycER expression were monitored by immunoblotting with anti-Myc antibodies after plating on FN in the absence (FN) or presence (Tx) of 50 nM tamoxifen. Levels of p27 and cyclin A expression in cells in suspension or at the indicated times after plating on FN in the presence or absence of 50 nM tamoxifen were monitored by immunoblotting. Total levels of Akt were monitored by immunoblotting as a control for total protein levels in the extracts.
FIG. 8.
FIG. 8.
Model for integrin regulation of the cell cycle in epithelial cells. Adhesion of epithelial cells to FN is sufficient to stimulate EGFR to activate PI-3K/Akt and Erk, leading to increased synthesis of cyclin D1, subsequent activation of cdk4, and phosphorylation of a subset of sites on Rb (solid boxes). However, induction of Myc, degradation of p27, subsequent activation of cdk2, and cyclin A synthesis are poorly induced by adhesion (dashed boxes). Consequently, cells do not enter into S phase. Signals stimulated by the addition of growth factors (or by overexpression of EGFR or Myc) are required to maximally inactivate p27, stimulate cdk2 activity, and subsequently induce the synthesis of cyclin A, which is required for progression into S phase.

Similar articles

Cited by

References

    1. Amati, B., K. Alevizopoulos, and J. Vlach. 1998. Myc and the cell cycle. Front. Biosci. 3:D250-D268. - PubMed
    1. Assoian, R. K., and M. A. Schwartz. 2001. Coordinate signaling by integrins and receptor tyrosine kinases in the regulation of G1 phase cell-cycle progression. Curr. Opin. Genet. Dev. 11:48-53. - PubMed
    1. Attwell, S., J. Mills, A. Troussard, C. Wu, and S. Dedhar. 2003. Integration of cell attachment, cytoskeletal localization, and signaling by integrin-linked kinase (ILK), CH-ILKBP, and the tumor suppressor PTEN. Mol. Biol. Cell 14:4813-4825. - PMC - PubMed
    1. Ausubel, F. M. (ed.). 2000. Current protocols in molecular biology. John Wiley & Sons, New York, N.Y.
    1. Batzer, A. G., D. Rotin, J. M. Urena, E. Y. Skolnik, and J. Schlessinger. 1994. Hierarchy of binding sites for Grb2 and Shc on the epidermal growth factor receptor. Mol. Cell. Biol. 14:5192-5201. - PMC - PubMed

Publication types