. 2004 Oct;24(19):8765-77.
doi: 10.1128/MCB.24.19.8765-8777.2004.

Early activation of sphingosine kinase in mast cells and recruitment to FcepsilonRI are mediated by its interaction with Lyn kinase

Affiliations

Early activation of sphingosine kinase in mast cells and recruitment to FcepsilonRI are mediated by its interaction with Lyn kinase

Nicole Urtz et al. Mol Cell Biol. 2004 Oct.

Abstract

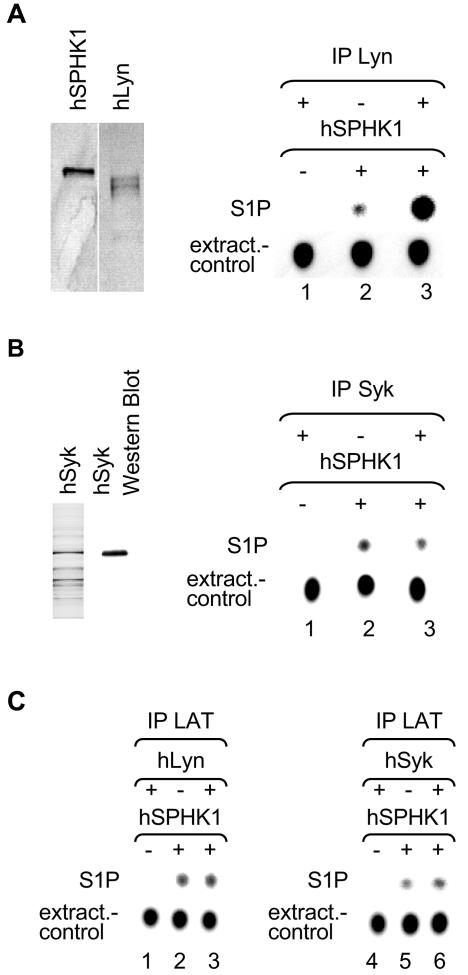
Sphingosine kinase has been recognized as an essential signaling molecule that mediates the intracellular conversion of sphingosine to sphingosine-1-phosphate. In mast cells, induction of sphingosine kinase and generation of sphingosine-1-phosphate have been linked to the initial rise in Ca(2+), released from internal stores, and to degranulation. These events either precede or are concomitant with the activation of phospholipase C-gamma and the generation of inositol trisphosphate. Here we show that sphingosine kinase type 1 (SPHK1) interacts directly with the tyrosine kinase Lyn and that this interaction leads to the recruitment of this lipid kinase to the high-affinity receptor for immunoglobulin E (FcepsilonRI). The interaction of SPHK1 with Lyn caused enhanced lipid and tyrosine kinase activity. After FcepsilonRI triggering, enhanced sphingosine kinase activity was associated with FcepsilonRI in sphingolipid-enriched rafts of mast cells. Bone marrow-derived mast cells from Lyn(-/)(-) mice, compared to syngeneic wild-type cells, were defective in the initial induction of SPHK1 activity, and the defect was overcome by retroviral Lyn expression. These findings position the activation of SPHK1 as an FcepsilonRI proximal event.


Figures

FIG. 1.
FIG. 1.
SPHK interacts with Lyn kinase in vitro. (A) Autoradiogram of an Ab array, showing mSPHK1 interacting proteins in IgE-Ag-stimulated BMMC. Proteins identified by this method are indicated to the right by solid arrows. c-Myc comprises a positive control Ab, as it recognizes the radiolabeled myc-tagged mSPHK1 directly. The dotted circle and dotted arrow indicates the position of an Ab to Syk tyrosine kinase that serves as a specificity control for the detected interaction with Lyn kinase. (B) Top panel, co-IP of in vitro transcribed and translated mLyn and mSPHK1. Lane 1, starting material-radiolabeled mLyn and mSPHK1, indicated by the arrows to the left; lane 2, starting material-radiolabeled mLyn; lanes 3 and 4, co-IP of radiolabeled mLyn by an Ab directed to the myc tag of mSPHK1 in the absence (lane 3) or presence (lane 4) of unlabeled mSPHK1 (indicated by IP SPHK); lane 5, starting material-radiolabeled mSPHK1; lanes 6 and 7, co-IP of radiolabeled mSPHK1 by an Ab directed to Lyn in the absence (lane 6) or presence (lane 7) of unlabeled mLyn (indicated by IP Lyn). Shown is one representative experiment of a series of six. Bottom panel, specificity control where radiolabeled p53 is substituted for mLyn under identical conditions as above and IP of p53 or SPHK (both proteins are radiolabeled) is done. Lane 8, starting material-radiolabeled p53 and mSPHK1, indicated by the arrows to the left; lane 9, starting material-radiolabeled p53; lanes 10 and 11, co-IP of radiolabeled p53 by an Ab directed to the myc tag of mSPHK1 (radiolabeled) in the absence (lane 10) or presence (lane 11) of radiolabeled mSPHK1 (indicated by IP SPHK); lane 12, starting material-radiolabeled mSPHK1; lanes 13 and 14, co-IP of radiolabeled mSPHK1by an Ab directed to p53 (radiolabeled) in the absence (lane 13) or presence (lane 14) of radiolabeled p53 (indicated by IP p53). Shown is one representative experiment of a series of two.
FIG. 2.
FIG. 2.
Murine and human SPHK1 interact with mLyn in HeLa cells. (A) Western blot analysis of transfected HeLa cells. Transfection or no transfection with the plasmids shown on the left are indicated above the lanes (+ or −). The Ab used for detection is shown on the right. (B) Co-IP of mSPHK activity by antiserum directed to Lyn from lysates of HeLa cells, transfected as described for panel A, as detected by an in vitro SPHK assay. Shown is an autoradiogram of a short or long exposure of a TLC plate showing the SPHK product S1P (as indicated). Fluram staining, which detects the primary amine of extracted S, is used to normalize the equal extraction of lipids as shown and is labeled (extract.-control). Western blotting (norm.), which detects the amount of recovered protein G-Sepharose beads, is used to normalize for IP. (C) Same experimental setting as described for panel B, but the mSPHK1 (myc-tagged) construct in the transfections was substituted by a construct for hSPHK1 (Flag tagged). (D) Top panel, Western blot analysis after transfection of HeLa cells using p53 instead of Lyn kinase as a specificity control for the above experiments. Bottom panel, SPHK activity in an IP of p53 after transfection of HeLa cells as a specificity control for the above experiments. Transfection conditions (A) were established and checked once for optimal expression, experiments shown in panels B to D are representatives out of a series of three.
FIG. 3.
FIG. 3.
Lyn recruits SPHK to the FcɛRI. (A) Western blot analysis, measuring hFcɛRI γ-chain induction in the recombinant HeLa cell line, using an anti-Flag tag Ab and antiserum directed to γ-chain (indicated to the left). As indicated, p42/44 Erk in cell lysates was used for normalization of protein concentration as detected by Western blot analysis. Time points of induction by doxycycline are shown above the lanes. (B) Co-IP of SPHK activity from lysates of transfected HeLa cells treated (+) or not treated (−) with doxycycline to induce FcɛRI γ-chain expression. The FcɛRI IP was with Ab to FcɛRIγ (as indicated) and was coupled to an in vitro SPHK assay. Input plasmids are indicated to the left, and also indicated is whether they were used (+) or not (−). Shown is an autoradiogram of a TLC plate. S1P on the TLC plate is indicated. As in Fig. 2, Fluram staining, normalizing for the equal extraction of lipids (extract.-control, indicated to the left), is shown. Induction of the FcɛRI γ-chain was for 48 to 72 h, as shown in panel A, lanes 3 and 4. (C) Co-IP of SPHK activity from lysates of transfected and IgE-Ag-stimulated (+) or nonstimulated (−) HeLa cells with Ab or antiserum to Flag (of FcɛRIγ, lanes 1 and 2) or γ-chain directly (lanes 3 and 4) or myc tags (of FcɛRIα, lanes 5 and 6) as indicated. IPs were coupled to an in vitro SPHK assay. The modest increase in FcɛRIγ seen in lane 6 was not reproducible in other experiments. Time kinetics of expression (A) were determined once; experiments in panels B and C are representatives out of a series of four.
FIG. 4.
FIG. 4.
SPHK directly binds to Lyn. (A) Left panel, silver-stained SDS-PAGE of the highly purified proteins as indicated above the lanes (hSPHK1 and hLyn); right panel, co-IP of hSPHK1 (activity) by an Ab to Lyn (indicated by IP Lyn) in the absence (−) of hSPHK1 (lane 1), in the absence of hLyn (lane 2), and in the presence (+) of both proteins (lane 3). An autoradiogram of a TLC plate is shown. The position of S1P on the TLC plate is indicated and Fluram staining is used to normalize for the equal extraction of lipids (extract.-control, indicated to the left). The concentration of hLyn used was 160 nM, the concentration of hSPHK1 used was 7 nM. (B) Left panel, silver-stained SDS-PAGE of a highly enriched baculovirus-expressed Syk and corresponding Western blot analysis to Syk as indicated; right panel, same experimental conditions as in panel A except that Lyn kinase was replaced with Syk kinase (see above). (C) Specificity control for hSPHK1 for panels A and B (see above) using the same experimental conditions. Ab to LAT was used to IP the mixtures where SPHK was incubated (+) with Lyn (left panel) or Syk (right panel) or from reactions where hSPHK1 or hLyn was absent (−) (lanes 1 and lane 2, respectively). Experiments in panels A and B were repeated three times, and the experiment in panel C was done twice.
FIG. 5.
FIG. 5.
Lipid and tyrosine kinase activities are enhanced in an SPHK/Lyn complex. (A) SPHK activity was assayed with different concentrations of purified hSPHK1 (as indicated on the top [nM]) either alone (uneven lanes; −) or in the presence of purified hLyn kinase (10 nM, even lanes; +). Shown are different autoradiogram exposures of a TLC plate used for separation of S1P (exposure time indicated to the right). Fluram stainings used for normalizing extraction of lipids (extract.-control, indicated to the right). (B) Autophosphorylation assay (in vitro kinase assay) of purified hLyn either alone (lane 1) or in a complex with two different concentrations of purified hSPHK1 protein as indicated (lanes 2 and 3). (C) Phosphorylation assay (in vitro kinase assay) of purified hLyn either alone (uneven lanes; −) or in a complex with purified (33 nM) hSPHK1 protein (even lanes; +) using a peptidic substrate ([Lys19] cdc2, indicated to the left). Autoradiogram exposure times are indicated to the right. Concentrations of hLyn protein are indicated above the lanes. (D) Phosphorylation assay (in vitro kinase assay) of purified hLyn, at indicated concentrations, either alone (uneven lanes; −) or in a complex with purified hSPHK1 protein (even lanes; +) on mFcɛRI γ-chain as a substrate. mFcɛRI γ-chain was isolated by IP from murine CPII mast cells, and identical aliquots of the IP were used as a substrate in thisassay. Panels B to D are autoradiograms of fixed and dried SDS-PAGE and peptide gels. (E) Top panel, specificity control using hc-Jun instead of Lyn kinase using identical experimental conditions as in panel A; bottom panel, inverse experiment where c-Jun is substituted for hSPHK1 and hLyn kinase activity is measured as in panel C. Experiments in panels A to E were done at least three times (between three and six), and one representative example is shown.
FIG. 6.
FIG. 6.
Influence of SPHK, S, and S1P on Lyn activity. (A) Lyn is an S-binding protein; S-binding dot blots using [3H]S and the indicated membrane-bound purified proteins. An autoradiogram is shown. The failure of hc-Jun, hFyn, hErk, and Flag protein to bind S serves as a negative control. This experiment was repeated three times. (B) Top panel, phosphorylation assay of hLyn either alone or in a complex with purified hSPHK1 protein in the presence (+) and absence (−) of S or S1P (as indicated to the left and above the lanes) using a peptidic substrate ([Lys19] cdc2). Concentrations are shown to the right; bottom panel, phosphorylation assay of hLyn either alone (lane 7) or with two additional lipids (galactosylsphingosine, lane 8; glucosylsphingosine, lane 9) as a specificity control for S/S1P effects. (C) Same experiment as in panel B (top panel) showing the inhibitory and dominant effect of S1P on Lyn activity when S and S1P are simultaneously added to the reaction. Experiments under panels B and C are representatives of a series of five and two repetitions.
FIG. 7.
FIG. 7.
SPHK can be found within lipid rafts where it is FcɛRI associated and activated by IgE-Ag. (A) Left panel, fractionation of BMMC extracts and SPHK activity assays of a low-salt (lane 1), high-salt (lane 2), and Triton-extractable (lane 3) fraction to crudely determine the cytoplasmic and membrane localization of the activity in unstimulated (nst; top panel) and IgE-Ag-stimulated (bottom panel) cells. A Western blot analysis of the γ-chain is shown, indicating successful isolation of membrane proteins. Right panel, SPHK activity assay of the raft fraction (20%) and the 30 and 40% fractions (as indicated) for mSPHK1-transfected CPII mouse mast cells, unstimulated (nst) and activated by IgE-Ag for the indicated time. Shown is an autoradiogram of a TLC plate. Production of S1P is shown at two different exposure times as indicated. Fluram staining is used to normalize for the equal extraction of lipids (extract.-control). Western blotting for LAT, PI3K, and FcɛRI γ-chain shows the successful partitioning of lipid rafts and the distribution of the receptor in the sucrose gradient. (B) IP of FcɛRI γ-chain from lipid rafts (20% sucrose fraction) of unstimulated (nst) or IgE-Ag-stimulated BMMC (at indicated times) and from the 30 and 40% sucrose fractions. IPs were coupled to an in vitro SPHK assay. Shown is an autoradiogram of a TLC plate. Production of S1P on the TLC plate is indicated. Fluram staining is used to normalize for the equal extraction of lipids (extract.-control), and Western blot analysis of FcɛRI γ-chain is used to normalize for IP. Densitometric quantitation of SPHK activity normalized to immunoprecipitated FcɛRI γ-chain is shown as a bar graph. All experiments were done at least three times; one representative example is shown.
FIG. 8.
FIG. 8.
Induction of SPHK activity and specific interaction with Lyn kinase in BMMC from wild-type and Lyn−/ mice. (A) Left panel, co-IP of SPHK activity by antisera directed to Lyn and LAT (used as negative control) from lysates of primary BMMC (nonstimulated [nst] and stimulated by IgE-Ag for 1 min) coupled to an in vitro SPHK assay. Shown is a representative autoradiogram of a TLC plate done twice. Production of S1P was measured on a TLC plate as shown. Fluram staining was used to normalize for the equal extraction of lipids (extract.-control) and a Western blot analysis, controlling for equal IP of endogenous expressed Lyn and LAT, is also shown. Right panel, bar graph shows densitometric quantitation of normalized SPHK activity coimmunoprecipitated with Lyn or LAT. (B) BMMC from Lyn−/ mice are defective in the early rise of SPHK1 activity after IgE-Ag triggering. Kinetics of SPHK1 activity induced by IgE-Ag triggering of mast cells from wild-type (wt) and Lyn−/ mice (shown as n-fold induction equal to relative levels of activity). Data represent the means ± standards deviations of six to eight independent experiments. The table shown in the bottom panel gives the absolute SPHK activity (pmol/min/mg) at basal (0 min), early peak (0.5 min), and late peak of activity (10 min). (C) Reintroduction of Lyn kinase in BMMC from Lyn−/ mice reestablishes the IgE-Ag-induced increase in the early phase of SPHK1 activity. Kinetics of IgE-Ag-induced SPHK1 activity in wild-type BMMC (wt) or that after reintroduction of wild-type Lyn into Lyn−/ BMMC (wt Lyn) are shown; nontransduced Lyn−/BMMC and vector only transduced Lyn−/ BMMC (mock reconstituted) are controls. Data represent means ± standard deviations of three experiments.

Similar articles

Cited by

References

    1. Albrecht, B., M. Woisetschlager, and M. W. Robertson. 2000. Export of the high affinity IgE receptor from the endoplasmic reticulum depends on a glycosylation-mediated quality control mechanism. J. Immunol. 165:5686-5694. - PubMed
    1. Baumruker, T., G. G. Pendl, and E. E. Prieschl. 1997. Gene regulation after Fc epsilon RI stimulation in the murine mast cell line CPII. Int. Arch. Allergy Immunol. 113:39-41. - PubMed
    1. Baumruker, T., and E. E. Prieschl. 2002. Sphingolipids and the regulation of the immune response. Semin. Immunol. 14:57-63. - PubMed
    1. Billich, A., F. Bornancin, P. Devay, D. Mechtcheriakova, N. Urtz, and T. Baumruker. 2003. Phosphorylation of the immunomodulatory drug FTY720 by sphingosine kinases. J. Biol. Chem. 278:47408-47415. - PubMed
    1. Brinkmann, V., M. D. Davis, C. E. Heise, R. Albert, S. Cottens, R. Hof, C. Bruns, E. Prieschl, T. Baumruker, P. Hiestand, C. A. Foster, M. Zollinger, and K. R. Lynch. 2002. The immune modulator FTY720 targets sphingosine 1-phosphate receptors. J. Biol. Chem. 277:21453-21457. - PubMed

Publication types