. 2004 Oct;24(19):8778-89.
doi: 10.1128/MCB.24.19.8778-8789.2004.

Protein phosphatase 2A negatively regulates insulin's metabolic signaling pathway by inhibiting Akt (protein kinase B) activity in 3T3-L1 adipocytes

Affiliations

Protein phosphatase 2A negatively regulates insulin's metabolic signaling pathway by inhibiting Akt (protein kinase B) activity in 3T3-L1 adipocytes

Satoshi Ugi et al. Mol Cell Biol. 2004 Oct.

Abstract

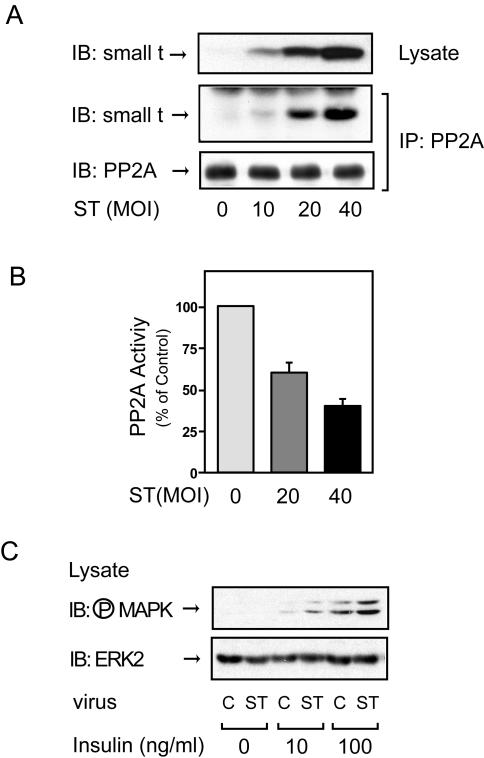
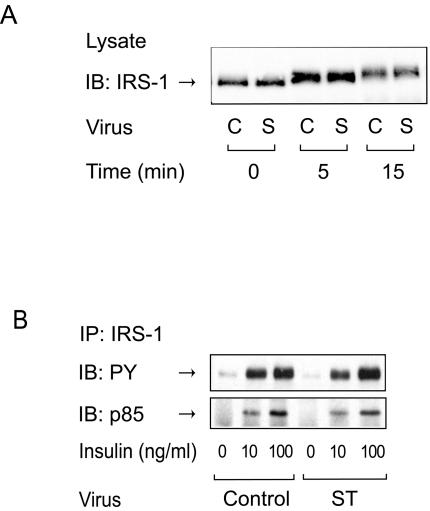
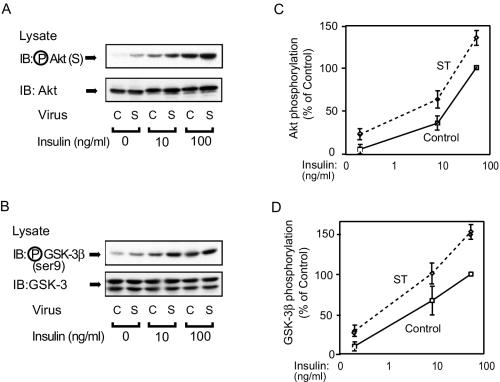
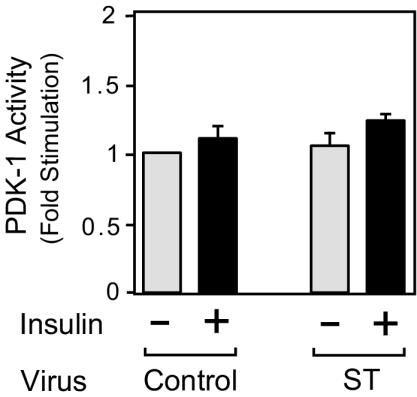
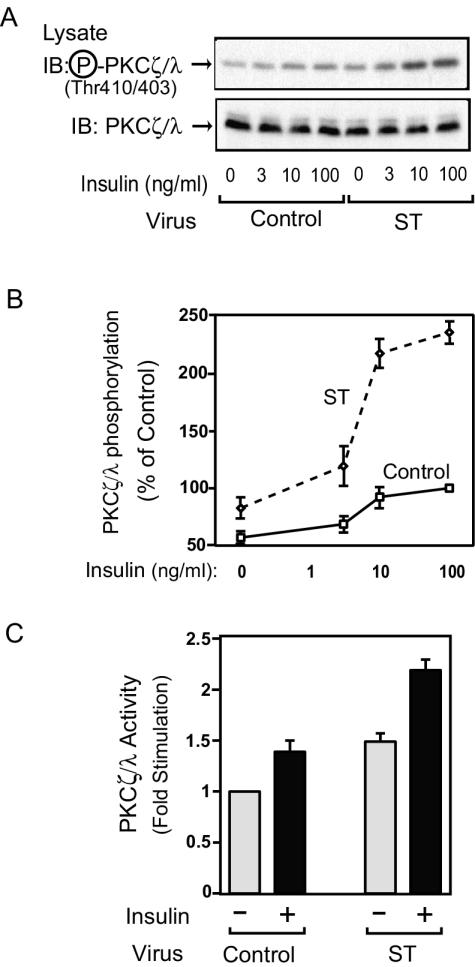
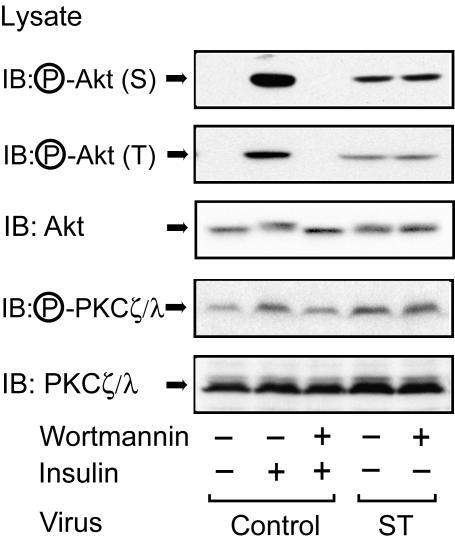
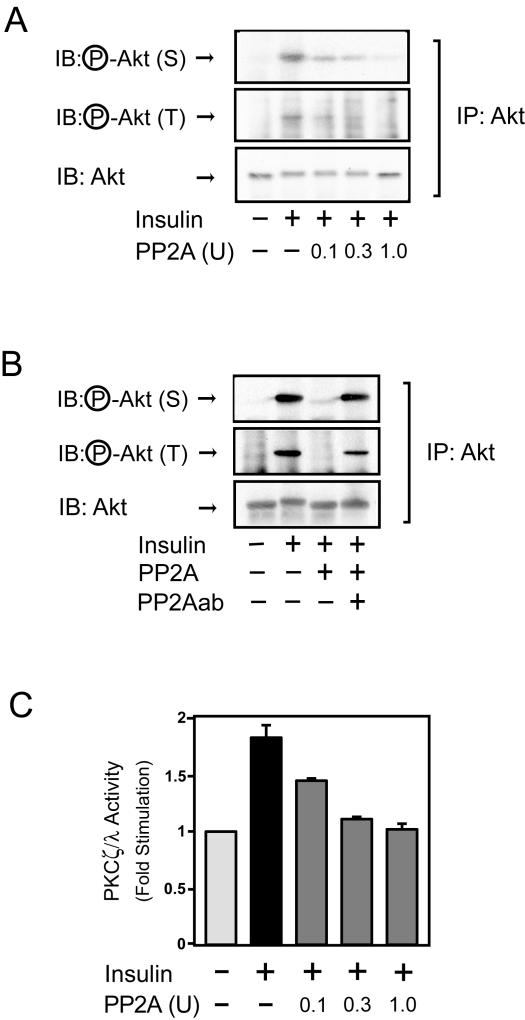
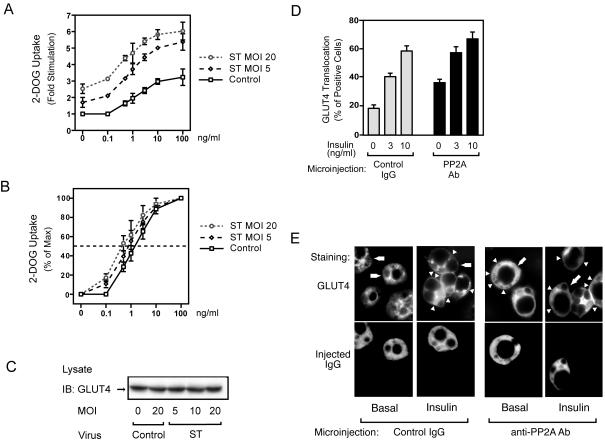
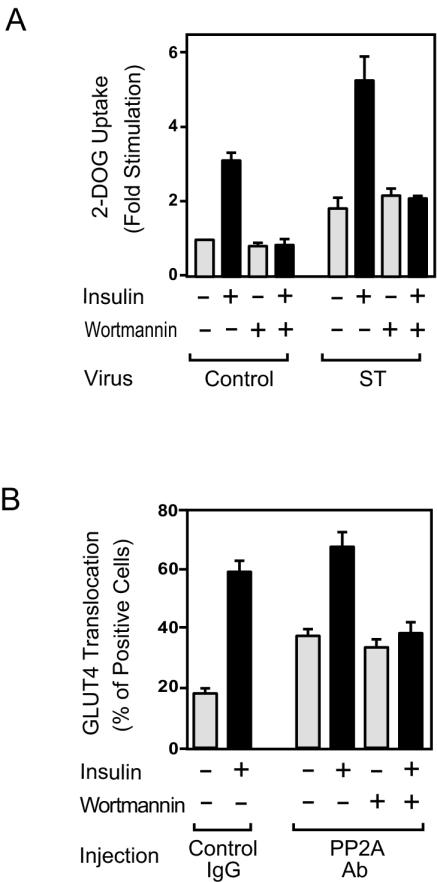
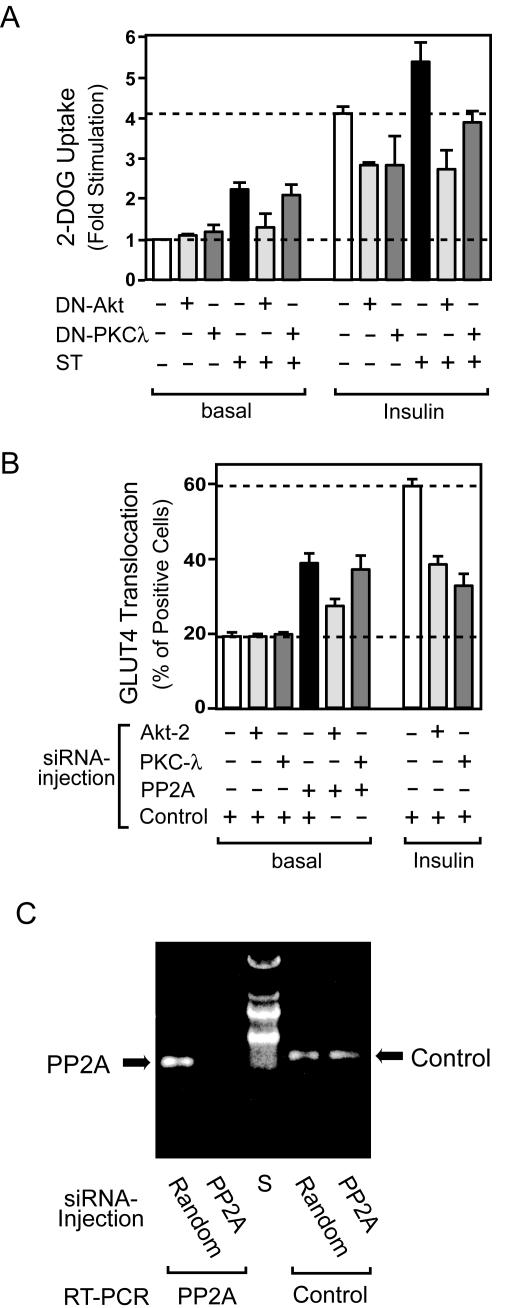
Protein phosphatase 2A (PP2A) is a multimeric serine/threonine phosphatase which has multiple functions, including inhibition of the mitogen-activated protein (MAP) kinase pathway. Simian virus 40 small t antigen specifically inhibits PP2A function by binding to the PP2A regulatory subunit, interfering with the ability of PP2A to associate with its cellular substrates. We have reported that the expression of small t antigen inhibits PP2A association with Shc, leading to augmentation of insulin and epidermal growth factor-induced Shc phosphorylation with enhanced activation of the Ras/MAP kinase pathway. However, the potential involvement of PP2A in insulin's metabolic signaling pathway is presently unknown. To assess this, we overexpressed small t antigen in 3T3-L1 adipocytes by adenovirus-mediated gene transfer and found that the phosphorylation of Akt and its downstream target, glycogen synthase kinase 3beta, were enhanced both in the absence and in the presence of insulin. Furthermore, protein kinase C lambda (PKC lambda) activity was also augmented in small-t-antigen-expressing 3T3-L1 adipocytes. Consistent with this result, both basal and insulin-stimulated glucose uptake were enhanced in these cells. In support of this result, when inhibitory anti-PP2A antibody was microinjected into 3T3-L1 adipocytes, we found a twofold increase in GLUT4 translocation in the absence of insulin. The small-t-antigen-induced increase in Akt and PKC lambda activities was not inhibited by wortmannin, while the ability of small t antigen to enhance glucose transport was inhibited by dominant negative Akt (DN-Akt) expression and Akt small interfering RNA (siRNA) but not by DN-PKC lambda expression or PKC lambda siRNA. We conclude that PP2A is a negative regulator of insulin's metabolic signaling pathway by promoting dephosphorylation and inactivation of Akt and PKC lambda and that most of the effects of PP2A to inhibit glucose transport are mediated through Akt.


Figures

FIG. 1.
FIG. 1.
Expression of small t antigen inhibits endogenous PP2A activity and enhances insulin-stimulated MAP kinase phosphorylation in 3T3-L1 adipocytes. (A) 3T3-L1 adipocytes infected with small-t-antigen-encoding adenovirus (ST) at the indicated MOIs, as described in Materials and Methods, were lysed, and whole-cell lysates were analyzed by Western blotting with anti-small t antigen antibody (top panel). The same lysates were immunoprecipitated (IP) with anti-PP2A antibody, followed by immunoblotting (IB) with anti-small t antigen antibody (middle panel) or anti-PP2A antibody (bottom panel). Control studies showed that the antibody (directed against the PP2A C subunit) precipitates intact PP2A. (B) 3T3-L1 adipocytes infected with small-t-antigen-encoding adenovirus at the indicated MOIs were lysed and assayed for PP2A activity. Data are presented as the percentage of phosphatase activity compared to that of uninfected cells and show the mean ± the standard error (SE) of results from four independent experiments. (C) 3T3-L1 adipocytes were infected with small-t-antigen-encoding adenovirus at an MOI of 40 and stimulated with insulin for 5 min, and whole-cell lysates were analyzed by Western blotting with phospho-specific MAP kinase antibody (upper panel) or anti-ERK-2 antibody (lower panel). C, control.
FIG. 2.
FIG. 2.
Expression of small t antigen does not affect tyrosine phosphorylation of IRS-1 or its association with PI 3-kinase. (A) 3T3-L1 adipocytes infected with either control virus (C) or small-t-antigen-encoding adenovirus (S) were starved and stimulated with insulin (100 ng/ml) for the indicated periods of time. Whole-cell lysates were analyzed by Western blotting with anti-IRS-1 antibody. (B) 3T3-L1 adipocytes infected with either control virus or small-t-antigen-encoding adenovirus (ST) were starved and stimulated with insulin for 3 min. Whole-cell lysates were prepared and immunoprecipitated (IP) with anti-IRS-1 antibody, followed by immunoblotting (IB) with anti-phosphotyrosine antibody (upper panel) or anti-p85 antibody (lower panel).
FIG. 3.
FIG. 3.
Akt and GSK-3β phosphorylation is enhanced in small-t-antigen-expressing cells. (A) 3T3-L1 adipocytes were infected with either control virus (C) or small-t-antigen-encoding adenovirus (S). Whole-cell lysates were prepared and analyzed by Western blotting with phospho-specific Akt antibody (upper panel) or anti-Akt antibody (lower panel). (B) The lysates shown in panel A were analyzed by Western blotting with phospho-specific GSK-3β antibody (upper panel) or anti-GSK-3β antibody (lower panel). (C and D) Data are presented as the percentage of Akt or GSK-3β phosphorylation levels compared with that seen with maximally stimulated control cells and represent the mean ± SE of results from three independent experiments.
FIG. 4.
FIG. 4.
Expression of small t antigen does not affect PDK-1 activity. 3T3-L1 adipocytes were infected with either control virus or small-t-antigen-encoding adenovirus (ST). Whole-cell lysates were prepared and assayed for PDK-1 activity as described in Materials and Methods. Data are presented as the increase in PDK-1 activity (n-fold) compared to unstimulated control cells and represent the mean ± SE of results from three independent experiments.
FIG. 5.
FIG. 5.
PKC λ phosphorylation and activity are enhanced in small-t-antigen-expressing 3T3-L1 adipocytes. (A) 3T3-L1 adipocytes were infected with either control virus or small-t-antigen-encoding adenovirus (ST), starved, and stimulated with insulin for 30 min. Whole-cell lysates were prepared and analyzed by Western blotting with phospho-specific PKC ζ/λ antibody (upper panel) or anti-PKC ζ/λ antibody (lower panel). (B) Data are shown as the percentage of PKC λ phosphorylation levels compared to that seen in maximally stimulated control cells and represent the mean ± SE of results from four independent experiments. (C) Cells were starved and stimulated with insulin for 30 min. Whole-cell lysates were immunoprecipitated with anti-PKC ζ/λ antibody and assayed for PKC λ activity as described in Materials and Methods. Data are presented as the increase (n-fold) in PKC λ activity compared to unstimulated control cells and represent the mean ± SE of results from three independent experiments.
FIG. 6.
FIG. 6.
Wortmannin does not inhibit small-t-antigen-induced Akt or PKC λ phosphorylation. 3T3-L1 adipocytes infected with either control virus or small-t-antigen-encoding adenovirus (ST) were starved, pretreated with 100 nM wortmannin for 30 min, and then stimulated with insulin (100 ng/ml) for 5 min (for Akt) or 30 min (for PKC λ). Whole-cell lysates were prepared and analyzed by Western blotting with phospho-specific Akt (serine 473) antibody (top panel), phospho-specific Akt (threonine 308) antibody (second panel from top), or phospho-specific PKC ζ/λ antibody (fourth panel from top). The same lysates were subjected to immunoblotting (IB) with anti-Akt antibody (third panel from top) or anti-PKC ζ/λ antibody (bottom panel).
FIG. 7.
FIG. 7.
PP2A dephosphorylates and inactivates Akt and PKC λ in vitro. (A) Cells were stimulated with insulin for 5 min. Whole-cell lysates were immunoprecipitated (IP) with anti-Akt antibody, and the immunoprecipitates were incubated with recombinant PP2A or buffer, followed by Western blotting with phospho-specific Akt (serine 473) antibody (top panel), phospho-specific Akt (threonine 308) antibody (middle panel) or anti-Akt antibody (bottom panel). (B) Anti-Akt immunoprecipitates from cells stimulated with insulin were incubated with recombinant PP2A that was preincubated with or without anti-PP2A antibody. The resultant immunoprecipitates were analyzed as described for panel A. (C) Cells were stimulated with insulin for 30 min. Whole-cell lysates were immunoprecipitated with anti-PKC ζ/λ antibody, incubated with recombinant PP2A, and assayed for PKC λ activity as described in Materials and Methods. Data are presented as the increase (n-fold) in PKC λ activity compared to unstimulated control cells and represent the mean ± SE of results from three independent experiments.
FIG. 8.
FIG. 8.
Glucose uptake is enhanced in small-t-antigen-expressing 3T3-L1 adipocytes. (A) 3T3-L1 adipocytes were infected with either control virus or small-t-antigen-encoding adenovirus (ST) at the indicated MOI and stimulated with insulin for 30 min. Glucose (2-DOG) uptake was measured as described in Materials and Methods. Data are presented as the increase (n-fold) in glucose uptake compared to that of unstimulated control cells and represent the mean ± SE of results from three independent experiments. (B) Data are presented as the percentage of the maximal response. (C) The expression of GLUT4 protein was unchanged by virus infection. 3T3-L1 adipocytes were infected with either control virus or small-t-antigen-encoding adenovirus (ST) at the indicated MOI. Whole-cell lysates were prepared and analyzed by Western blotting using anti-GLUT4 antibody. (D) 3T3-L1 adipocytes on coverslips were microinjected with anti-PP2A antibody or with sheep IgG as a control. Cells were starved and stimulated with insulin for 20 min. GLUT4 staining was performed as described in Materials and Methods. Data are presented as the percentage of cells positive for GLUT4 translocation, calculated by counting at least 100 cells, and represent the mean ± SE of results from three independent experiments. (E) Representative images of cells depicting GLUT4 staining from the experiment described for panel D. Open triangles indicate the GLUT4 ring, the thin line at cell edges, scored as positive. Lower panels show the injected cells, and the open arrows in the upper panels point to these injected cells.
FIG. 9.
FIG. 9.
The stimulatory effects of PP2A inhibition on glucose uptake and GLUT4 translocation are not inhibited by wortmannin. (A) 3T3-L1 adipocytes infected with either control virus or small-t-antigen-encoding adenovirus (ST) were starved, pretreated with 100 nM wortmannin for 30 min, and then stimulated with insulin (100 ng/ml) for 30 min. Glucose (2-DOG) uptake was measured as described in Materials and Methods. Data are presented as the increase (n-fold) in glucose uptake compared to unstimulated control cells and represent the mean ± SE of results from three independent experiments. (B) 3T3-L1 adipocytes on coverslips were microinjected with anti-PP2A antibody (Ab) or with sheep IgG as a control. Cells were starved, pretreated with 100 nM wortmannin for 30 min, and then stimulated with insulin for 20 min. Fixed cells were stained with rabbit anti-GLUT4 antibody, as described in Materials and Methods. The percentage of cells positive for GLUT4 translocation was calculated as described in Materials and Methods. The data shown are the mean ± SE of results from four independent experiments.
FIG. 10.
FIG. 10.
The stimulatory effects of PP2A inhibition on glucose (2-DOG) uptake and GLUT4 translocation are dependent on Akt but not on PKC λ. (A) 3T3-L1 adipocytes infected with either control virus or adenovirus encoding DN-Akt, DN-PKC λ, or small t antigen (at MOIs of 50, 80, and 40, respectively) were stimulated with insulin (100 ng/ml) for 30 min. Glucose uptake was measured as described in Materials and Methods. Data are presented as the increase (n-fold) in glucose uptake compared to unstimulated control cells and represent the mean ± SE of results from three independent experiments. (B) 3T3-L1 adipocytes on coverslips were microinjected with each siRNA mixture, which targets Akt2 and negative control (NC), PKC λ and NC, PP2A and NC, Akt2 and PP2A, PKC λ and PP2A, or NC alone. The final concentration of siRNA mixtures is adjusted to 5 μM with or without control siRNA. Cells were starved and stimulated with insulin for 20 min. GLUT4 staining was performed as described in Materials and Methods. Data shown are the mean ± SE of results from three or four independent experiments. (C) The efficiency of siRNA against PP2A during the microinjection experiments was confirmed by reverse transcription (RT)-PCR. Approximately 200 mature 3T3-L1 adipocytes in 3 μl of complete medium were spotted on col-lagen-coated coverslips and incubated for 15 min in a humidified chamber, and the chamber was then filled with complete medium. The next day, all of the cells were microinjected with PP2A or negative control (Random) siRNA. Forty-eight hours after microinjection, cells were scraped, and total RNA was purified with an RNeasy minikit (QIAGEN). The RT-PCR was performed with a PP2A-specific or GRK2 (Control) primer set by using a one-step RT-PCR kit (QIAGEN). A representative image from two independent experiments is shown. S, size marker.

Similar articles

Cited by

References

    1. Abraham, D., K. Podar, M. Pacher, M. Kubicek, N. Welzel, B. A. Hemmings, S. M. Dilworth, H. Mischak, W. Kolch, and M. Baccarini. 2000. Raf-1-associated protein phosphatase 2A as a positive regulator of kinase activation. J. Biol. Chem. 275:22300-22304. - PubMed
    1. Aguirre, V., E. D. Werner, J. Giraud, Y. H. Lee, S. E. Shoelson, and M. F. White. 2002. Phosphorylation of Ser307 in insulin receptor substrate-1 blocks interactions with the insulin receptor and inhibits insulin action. J. Biol. Chem. 277:1531-1537. - PubMed
    1. Ahmad, F., R. V. Considine, T. L. Bauer, J. P. Ohannesian, C. C. Marco, and B. J. Goldstein. 1997. Improved sensitivity to insulin in obese subjects following weight loss is accompanied by reduced protein-tyrosine phosphatases in adipose tissue. Metabolism 46:1140-1145. - PubMed
    1. Ahmad, F., and B. J. Goldstein. 1995. Increased abundance of specific skeletal muscle protein-tyrosine phosphatases in a genetic model of insulin-resistant obesity and diabetes mellitus. Metabolism 44:1175-1184. - PubMed
    1. Alessi, D. R., N. Gomez, G. Moorhead, T. Lewis, S. M. Keyse, and P. Cohen. 1995. Inactivation of p42 MAP kinase by protein phosphatase 2A and a protein tyrosine phosphatase, but not CL100, in various cell lines. Curr. Biol. 5:283-295. - PubMed

Publication types

MeSH terms