. 2004 Oct;16(10):2665-82.
doi: 10.1105/tpc.104.024281. Epub 2004 Sep 14.

DNA gyrase is involved in chloroplast nucleoid partitioning

Affiliations

DNA gyrase is involved in chloroplast nucleoid partitioning

Hye Sun Cho et al. Plant Cell. 2004 Oct.

Abstract

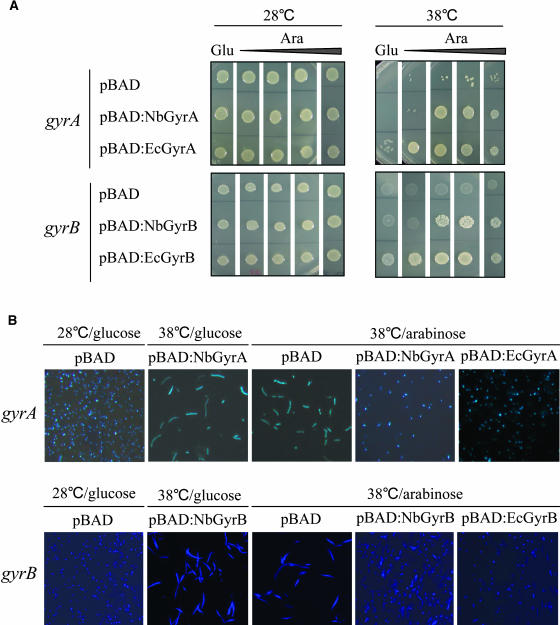
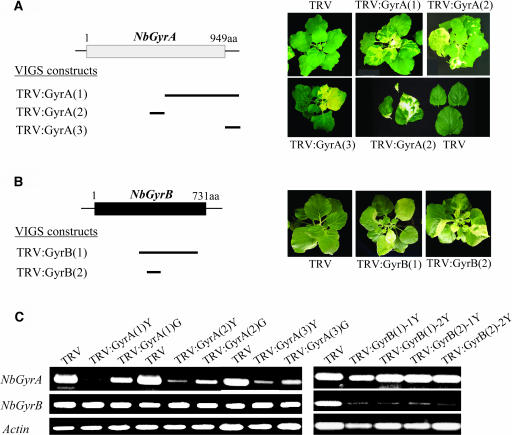
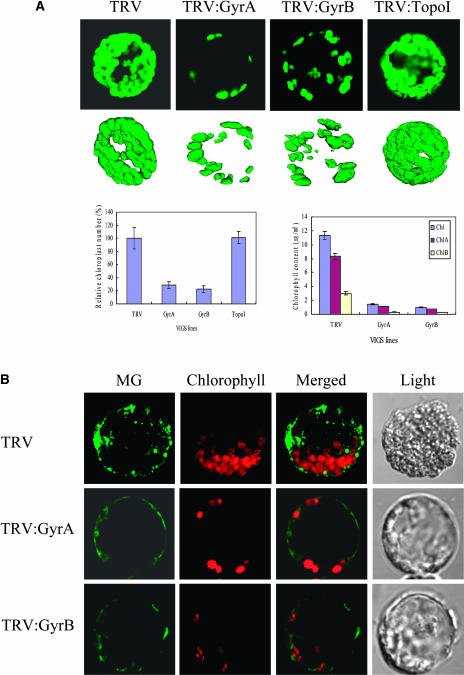
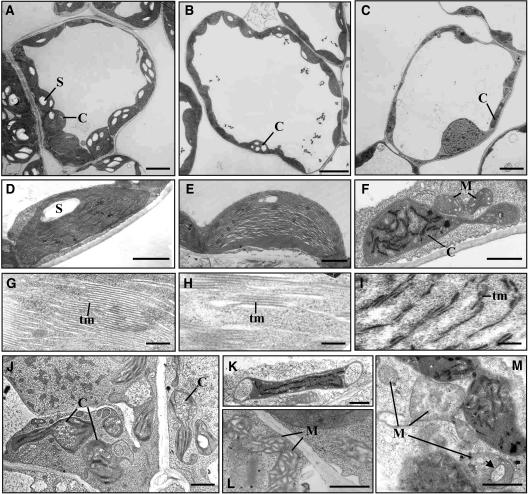
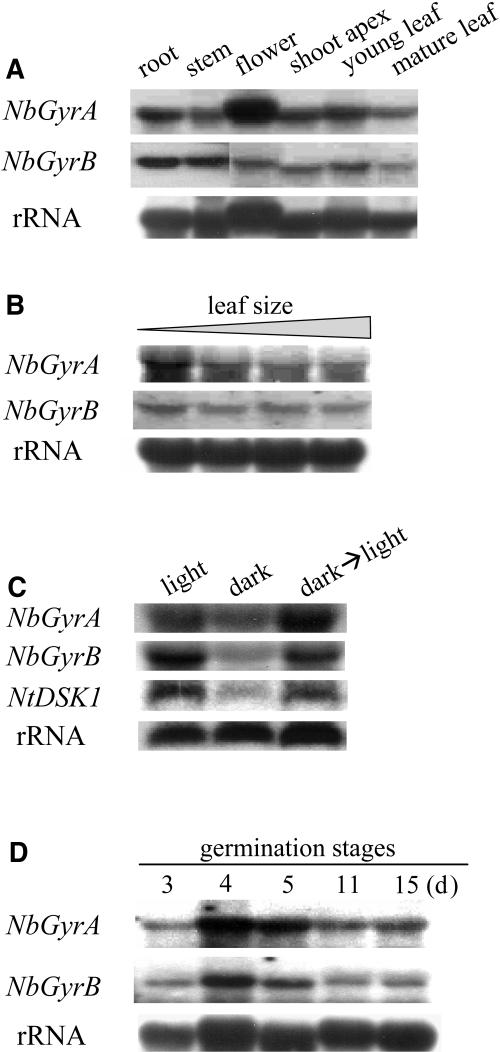
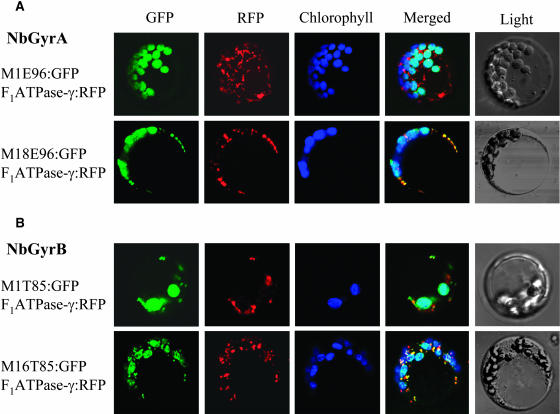
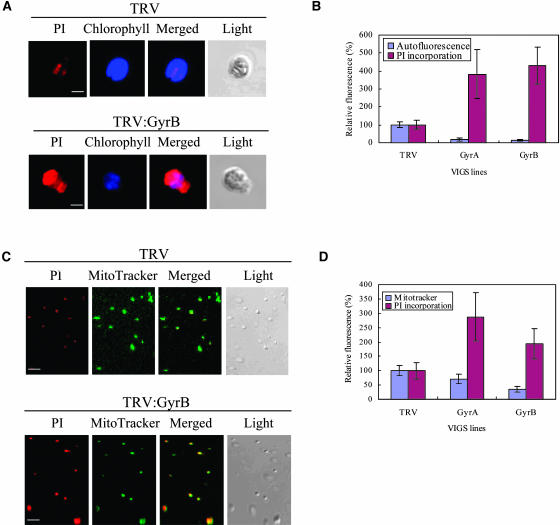
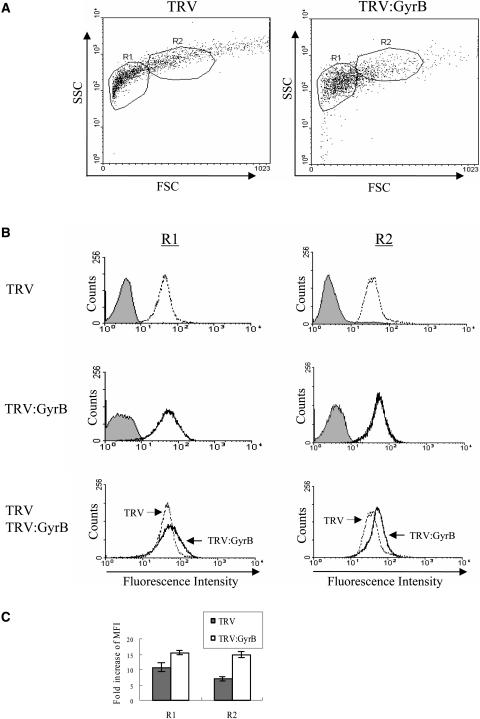
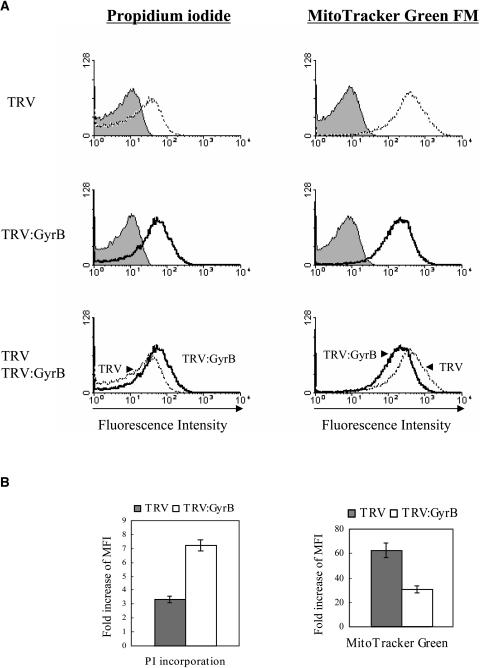
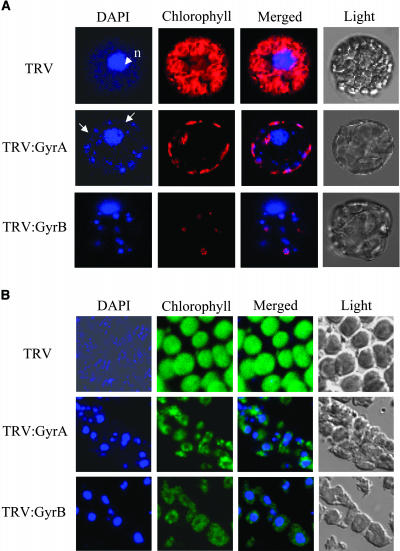
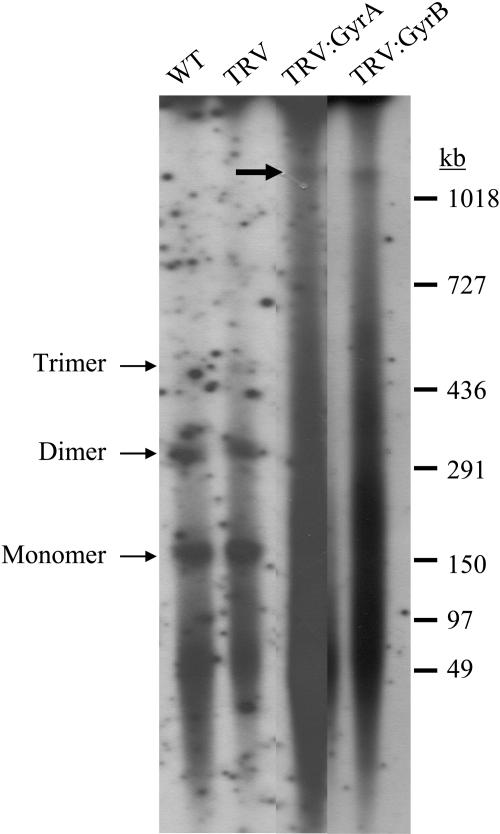
DNA gyrase, which catalyzes topological transformation of DNA, plays an essential role in replication and transcription in prokaryotes. Virus-induced gene silencing of NbGyrA or NbGyrB, which putatively encode DNA gyrase subunits A and B, respectively, resulted in leaf yellowing phenotypes in Nicotiana benthamiana. NbGyrA and NbGyrB complemented the gyrA and gyrB temperature-sensitive mutations of Escherichia coli, respectively, which indicates that the plant and bacterial subunits are functionally similar. NbGyrA and NbGyrB were targeted to both chloroplasts and mitochondria, and depletion of these subunits affected both organelles by reducing chloroplast numbers and inducing morphological and physiological abnormalities in both organelles. Flow cytometry analysis revealed that the average DNA content in the affected chloroplasts and mitochondria was significantly higher than in the control organelles. Furthermore, 4',6-diamidino-2-phenylindole staining revealed that the abnormal chloroplasts contained one or a few large nucleoids instead of multiple small nucleoids dispersed throughout the stroma. Pulse-field gel electrophoresis analyses of chloroplasts demonstrated that the sizes and/or structure of the DNA molecules in the abnormal chloroplast nucleoids are highly aberrant. Based on these results, we propose that DNA gyrase plays a critical role in chloroplast nucleoid partitioning by regulating DNA topology.


Figures

Figure 1.
Figure 1.
Functional Complementation of E. coli gyrA and gyrB Mutants. (A) Suppression of gyrA and gyrB thermosensitive growth phenotypes. Top, the E. coli strain harboring a temperature-sensitive gyrA mutation (KNK452) was transformed with the pBAD vector control, pBAD:NbGyrA, or pBAD:EcGyrA. The transformants were plated on NZY agar containing glucose (0.2%) or arabinose (0.0002, 0.002, 0.02, and 0.2%) to repress and induce, respectively, the expression of the genes from the PBAD promoter and incubated for 2 d at the indicated temperatures. Bottom, complementation of the E. coli gyrB mutant (N4177) was performed in the same way. (B) Bacterial cell shapes. Overnight cultures of E. coli gyrA (KNK452) and gyrB (N4177) mutants and their various transformants grown in NZY broth (+ 0.2% glucose) at 28°C were diluted 1:100 in NZY (+ 0.2% glucose or + 0.2% arabinose) and incubated at 28 or 38°C for 10 h. The cells were then stained with DAPI and observed under a fluorescent microscope (40×).
Figure 2.
Figure 2.
VIGS Phenotypes and Suppression of the Endogenous Transcripts. (A) Schematic representation of the structure of NbGyrA, the cDNA regions used in the VIGS constructs, and the VIGS phenotypes of the three TRV:GyrA VIGS lines. The box indicates the protein-coding region of NbGyrA. The three VIGS constructs containing different regions of the NbGyrA cDNA are marked by bars. N. benthamiana plants were infected with Agrobacterium containing the TRV control or one of the TRV:GyrA constructs. The plants were photographed 20 d postinoculation. The whole plants and individual leaves from the TRV control and TRV:GyrA lines are shown. aa, amino acids. (B) Schematic representation of the structure of NbGyrB, the cDNA regions used in the VIGS constructs, and the VIGS phenotypes of the two TRV:GyrB VIGS lines. The box indicates the protein-coding region of NbGyrB. The two VIGS constructs containing different regions of the NbGyrB cDNA are marked by bars. The plants were photographed 20 d postinoculation and exhibited the same phenotype as the TRV:GyrA VIGS lines. (C) Semiquantitative RT-PCR analysis to examine the transcript levels of NbGyrA and NbGyrB. The primers were designed to exclude the cDNA regions used in the VIGS constructs. RNA was extracted from the yellow (Y) or green (G) sectors of the leaves from the VIGS plants. Two independent plants were each analyzed for TRV:GyrB(1) and TRV:GyrB(2). As a control, the actin mRNA levels were examined.
Figure 3.
Figure 3.
Numbers of Chloroplasts and Mitochondria. (A) Confocal laser scanning microscopy of chloroplasts in protoplasts isolated from the TRV, TRV:GyrA, TRV:GyrB, and TRV:TopoI VIGS lines. The upper panels show one- and three-dimensional images of typical chloroplasts. Confocal microscopy was used to determine the number of chloroplasts per protoplast (left histogram). The TRV control had on average 53 chloroplasts per protoplast. The data points represent means ± sd of 40 to 50 individual protoplasts. Chlorophyll contents in leaves from the VIGS lines (right histogram) were measured as described (Porra et al., 1989). (B) To visualize mitochondria, protoplasts isolated from leaves of the VIGS lines were stained with 200 nM MG for 1 to 2 min.
Figure 4.
Figure 4.
Ultrastructural Analysis of Mesophyll Cell Chloroplasts and Mitochondria. (A) to (I) Transmission electron micrographs of a leaf mesophyll cell ([A] to [C]), chloroplasts ([D] to [F]), and chloroplast thylakoid membranes ([G] to [I]). TRV control ([A], [D], and [G]) and green ([B], [E], and [H]) and yellow sectors ([C], [F], and [I]) of leaves from the TRV:GyrB line are shown. Note that the TRV:GyrB chloroplast exhibits dumbbell-shaped morphology with central constriction (F). (J) and (K) Transmission electron micrographs of the dumbbell-shaped (J) and degrading chloroplasts (K) from the TRV:GyrA line. (L) and (M) Transmission electron micrograph of mesophyll mitochondria from the TRV control (L) and the TRV:GyrB line (M). The arrowhead indicates the region that appears to be disintegrating. C, chloroplast; S, starch; M, mitochondrion; tm, thylakoid membrane. Bars = 5 μm in (A) to (C), 1 μm in (D) to (F) and (J) to (M), and 0.1 μm in (G) to (I).
Figure 5.
Figure 5.
Expression of the NbGyrA and NbGyrB Genes. RNA gel blot analysis was performed with total RNA from N. benthamiana plants. Each lane represents 30 μg of total RNA. (A) Expression in various tissues. (B) Expression in leaves of various sizes. From left, 0.5, 2, 5, and 9 cm. (C) Light-stimulated expression. Seven-day-old seedlings grown with 16 h light and 8 h dark (light), in the dark (dark), or grown in the dark and then transferred to light for 1 h (dark→light) were used. As a control for the light regulation, the expression of NtDSK1, which encodes a chloroplast-targeted dual-specificity protein kinase (Cho et al., 2001), was examined. (D) Expression in seedlings at various stages of growth. The transcript levels were measured in germinated seedlings 3 to 15 d after sowing.
Figure 6.
Figure 6.
Targeting of NbGyrA and NbGyrB to Both Chloroplasts and Mitochondria. Arabidopsis protoplasts were transformed with the GFP fusion constructs as well as with the F1ATPase-γ:RFP construct to mark the mitochondria, and the localization of the fluorescent signals was examined 24 h after transformation under a confocal laser scanning microscope. Chloroplasts and mitochondria were visualized by chlorophyll autofluorescence and the red fluorescence of F1ATPase-γ:RFP, respectively. The false color (blue) was used for chlorophyll autofluorescence to distinguish it from the red fluorescence of RFP. The merged images of GFP, RFP, and chlorophyll autofluorescence as well as bright-field images are shown. The M18E96:GFP fusion protein of NbGyrA and the M16T85:GFP fusion protein of NbGyrB used the alternative in-frame translation sites. (A) GFP was fused to the N-terminal peptides of NbGyrA, resulting in M1E96:GFP and M18E96:GFP. (B) GFP was fused to the N-terminal peptides of NbGyrB, resulting in M1T85:GFP and M16T85:GFP.
Figure 7.
Figure 7.
Increased DNA Content in Abnormal Chloroplasts and Mitochondria. Chloroplasts isolated from the fourth to sixth leaves above the infiltrated leaf of each VIGS line were stained with PI, and the mitochondria were stained with PI and MG, as described in Methods. The false color (blue) was used for chlorophyll autofluorescence to distinguish it from the red PI fluorescence. (A) PI staining and chlorophyll autofluorescence images of representative chloroplasts from the TRV (top) and TRV:GyrB (bottom) lines. Bars = 5 μm. (B) The average PI fluorescence and chlorophyll autofluorescence of individual chloroplasts. PI incorporation in chloroplasts from the TRV:GyrA and TRV:GyrB lines is ∼3.8- to 4.3-fold higher than in the TRV control chloroplasts. The data points represent means ± sd of 30 to 32 selected single chloroplasts. (C) PI- and MG-staining images of mitochondria from the TRV (top) and TRV:GyrB (bottom) lines. Bars = 10 μm. (D) The average PI and MG fluorescence of individual mitochondria. PI incorporation in mitochondria from the TRV:GyrA and TRV:GyrB lines was 2.8-fold and twofold higher than in the TRV control mitochondria, respectively. MG incorporation in mitochondria from the TRV:GyrA and TRV:GyrB lines was 69 and 37% of that in the TRV control mitochondria, respectively. The data points represent means ± sd of 60 to 80 selected single mitochondria.
Figure 8.
Figure 8.
Flow Cytometry Profiles of Chloroplasts. Fifty thousand chloroplasts isolated from the fourth to sixth leaves above the infiltrated leaf of each VIGS line were fixed, stained with PI, and analyzed by flow cytometry. (A) Light scatter cytogram. FSC and SSC represent forward light scatter and side scatter, respectively. The single chloroplasts and aggregates of two to four chloroplasts are mostly enclosed in the R1 and R2 regions, respectively. (B) DNA histogram of the R1 and R2 regions of TRV and TRV:GyrB. The filled histogram represents the fluorescence profile before PI staining of the chloroplasts. Chloroplasts from the TRV:GyrB line contain higher DNA contents than the TRV control chloroplasts in both R1 and R2. (C) Fold increase of mean fluorescence intensity (MFI) in R1 and R2 compared with the MFI before PI staining. The fold increase of MFI in TRV:GyrB is 1.5- and 2.1-fold higher than that in the TRV control in R1 and R2, respectively, which indicates that the DNA contents in the chloroplasts in the R1 and R2 regions are on average 1.5- and 2.1-fold higher, respectively, compared with the DNA contents of TRV control chloroplasts. The data points represent means ± sd of three independent experiments.
Figure 9.
Figure 9.
Flow Cytometry Profiles of Mitochondria. Twenty thousand mitochondria isolated from the fourth to sixth leaves above the infiltrated leaf of each VIGS line were fixed, stained with PI and MG, and analyzed by flow cytometry. (A) DNA histogram of mitochondria of the TRV and TRV:GyrB lines. The fluorescence profiles of PI (indicating DNA contents) and MG staining (indicating mitochondrial mass) were analyzed. The filled histogram represents the fluorescence profile before the staining of mitochondria. The mitochondria from the TRV:GyrB line had higher DNA contents but lower masses than those from the TRV control. (B) Fold increase of MFI compared with the MFI before PI and MG staining. The fold increase of MFI of PI staining in TRV:GyrB is 2.1-fold higher than that of the TRV control, which indicates the TRV:GyrB mitochondria have on average 2.1-fold higher DNA contents than TRV mitochondria. The fold increase of MFI of MG staining in TRV:GyrB is twofold lower than that in the TRV control, which indicates the TRV:GyrB mitochondria have on average a twofold lower mitochondrial mass. The data points represent the means ± sd of three independent experiments.
Figure 10.
Figure 10.
DAPI Staining of Organelle Genomes. (A) DAPI staining of protoplasts isolated from the fourth leaf above the infiltrated leaf of TRV, TRV:GyrA, and TRV:GyrB VIGS lines. Fluorescent signals of DAPI and chlorophyll were examined under a confocal laser scanning microscope. Arrows indicate the cytosolic fluorescent spots that probably represent individual and aggregated organelles. n, nucleus. (B) DAPI staining of individual chloroplasts from TRV, TRV:GyrA, and TRV:GyrB VIGS lines.
Figure 11.
Figure 11.
PFGE Analysis of Chloroplast DNA. PFGE of chloroplast DNA was performed as described (Lilly et al., 2001). The membrane was hybridized with the radiolabeled rbcL gene probe. Small arrows indicate the bands representing monomeric, dimeric, and trimeric molecules of chloroplast DNA. The big arrow indicates a large chloroplast DNA band (>1000 kb). DNA size markers are indicated in kilobases.

Similar articles

Cited by

References

    1. Blanc-Potard, A.-B., and Bossi, L. (1994). Phenotypic suppression of DNA gyrase deficiencies by a deletion lowering the gene dosage of a major tRNA in Salmonella typhimurium. J. Bacteriol. 176, 2216–2226. - PMC - PubMed
    1. Champoux, J.J. (2001). DNA topoisomerases: Structure, function, and mechanism. Annu. Rev. Biochem. 70, 369–413. - PubMed
    1. Cho, H.S., Yoon, G.M., Lee, S.S., Kim, Y.A., Hwang, I., Choi, D., and Pai, H.S. (2001). A novel dual-specificity protein kinase targeted to the chloroplast in tobacco. FEBS Lett. 497, 124–130. - PubMed
    1. Corbett, K.D., and Berger, J.D. (2003). Emerging roles for plant topoisomerase VI. Chem. Biol. 10, 107–111. - PubMed
    1. Douce, R., Bourguignon, J., Brouquisse, R., and Neuburger, M. (1987). Isolation of plant mitochondria. Methods Enzymol. 148, 403–415.

Publication types

Associated data

LinkOut - more resources