. 2005 Feb 1;385(Pt 3):677-84.
doi: 10.1042/BJ20040891.

Phosphorylation and desensitization of the lysophosphatidic acid receptor LPA1

Affiliations

Phosphorylation and desensitization of the lysophosphatidic acid receptor LPA1

S Eréndira Avendaño-Vázquez et al. Biochem J. .

Abstract

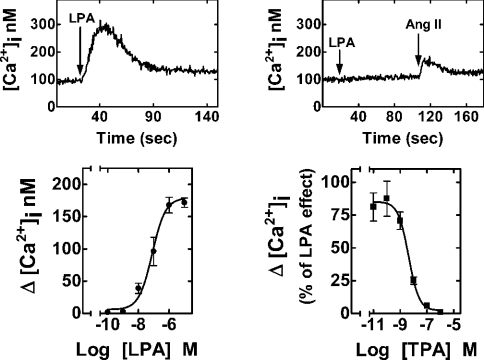
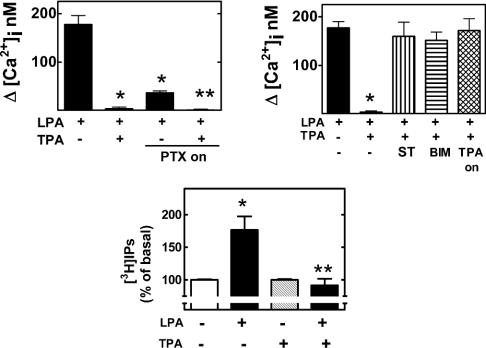
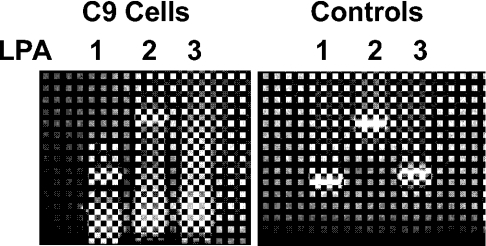
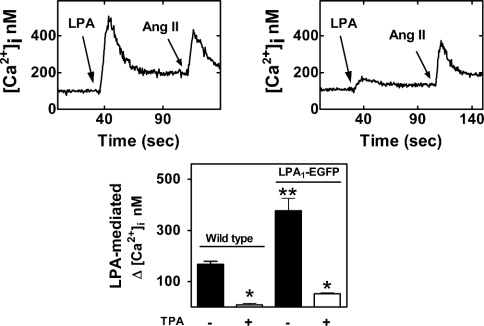
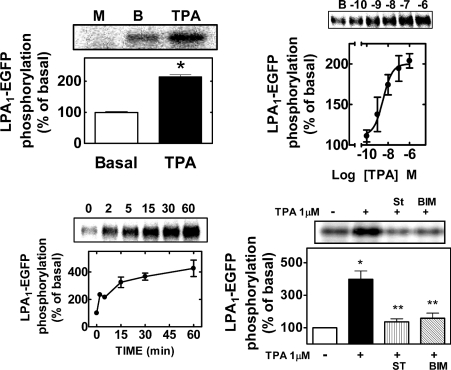
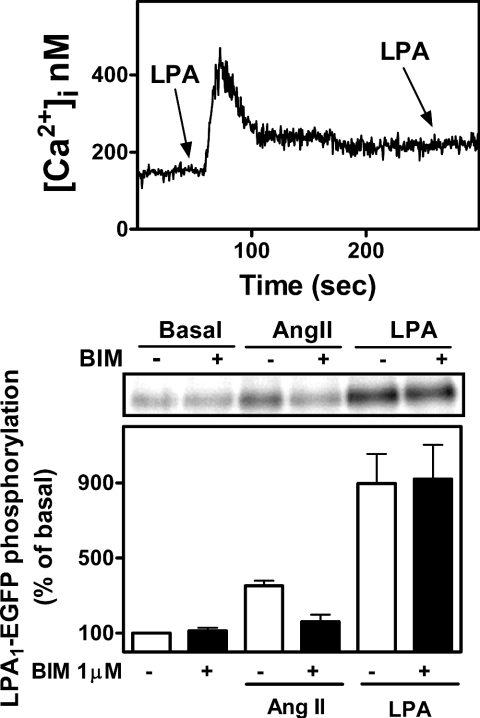
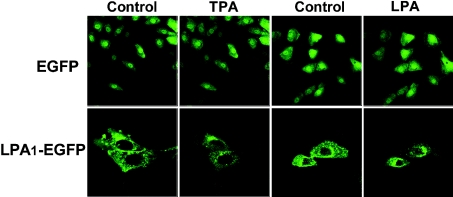
In C9 cells, LPA (lysophosphatidic acid) induced inositol phosphate production, increased intracellular calcium concentration and inhibited adenylate cyclase activity. These responses were abolished in cells challenged with active phorbol esters. Action of phorbol esters was blocked by inhibitors of PKC (protein kinase C) and by its down-regulation. LPA1 receptor phosphorylation was observed in response to phorbol esters. The effect was rapid (t1/2 approximately 1 min), intense (2-fold) and sustained (at least 60 min). PKC inhibitors markedly decreased the LPA1 receptor phosphorylation induced by phorbol esters. LPA1 receptor tagged with the green fluorescent protein internalized in response to PKC activation. In addition, LPA and angiotensin II were also capable of inducing LPA1 receptor phosphorylation, showing that LPA1 receptor can be subjected to homologous and heterologous desensitization.


Figures

Figure 1
Figure 1. Effects of LPA and PMA on [Ca2+]i
C9 cells endogenously expressing LPA receptors were loaded with fura 2. Representative [Ca2+]i traces are presented in cells challenged with 1 μM LPA (upper left panel) or treated with 1 μM PMA for 5 min and then challenged with 1 μM LPA and subsequently with 100 nM angiotensin II (upper right panel). Lower left panel: effect of different concentrations of LPA on [Ca2+]i. Lower right panel: effect of different concentrations of PMA (TPA) on the increase in [Ca2+]i induced by 1 μM LPA. In the lower panels, mean values are plotted and vertical lines represent the S.E.M. for 6–12 experiments using different cell preparations. Where no vertical lines are shown, they are within the symbols.
Figure 2
Figure 2. Effects of PKC and the roles of pertussis-toxin-sensitive G-proteins in the actions of LPA
Cells were incubated with the agents indicated as described in the Materials and methods section. LPA, 1 μM LPA; TPA, 1 μM PMA; TPA-on, PMA (1 μM, incubated overnight); PTX-on, pertussis toxin 100 ng/ml overnight; ST, preincubation with 300 nM staurosporine before the addition of other agents; BIM, preincubation with 1 μM bisindolylmaleimide I before the addition of other agents. Mean values are plotted and vertical lines represent the S.E.M. for 6–12 experiments using different cell preparations. Upper left panel: *P<0.001 versus LPA alone, **P<0.001 versus LPA alone and P<0.05 versus LPA treated with pertussis toxin. Upper right panel: *P<0.001 versus all the other treatments. Lower panel: *P<0.01 versus basal (no treatment); **P<0.01 versus LPA without PMA.
Figure 3
Figure 3. Expression of mRNA of LPA receptors in C9 cells
RT–PCR products LPA1 (349 pb), LPA2 (798 pb) and LPA3 (382 pb) using total RNA from C9 cells as template (left panel) or plasmid cDNA of mLPA1, hLPA2 and hLPA3 (right panel).
Figure 4
Figure 4. Effects of LPA and PMA on [Ca2+]i in cells stably expressing LPA1–EGFP
C9 cells expressing LPA1–EGFP receptors were loaded with fura 2. Representative [Ca2+]i traces are presented in cells challenged with 1 μM LPA and subsequently with 100 nM angiotensin II (upper left panel) or treated with 1 μM PMA for 5 min and then challenged with 1 μM LPA and subsequently with 100 nM angiotensin II (upper right panel). Lower panel, comparison of the effects of 1 μM LPA in wild-type cells or cells expressing LPA1–EGFP receptors, and pretreated without or with 1 μM PMA for 5 min. Mean values are plotted and vertical lines represent the S.E.M. for six experiments using different cell preparations. *P<0.001 versus absence of PMA; **P<0.001 versus wild-type.
Figure 5
Figure 5. LPA1–EGF receptor phosphorylation
C9 cells stably expressing LPA1–EGFP receptor were metabolically labelled with [32P]Pi and the LPA1–EGFP receptor was immunoprecipitated using anti-EGFP polyclonal rabbit antibodies. Upper left panel: LPA1–EGFP basal phosphorylation (BASAL) or that induced by 1 μM PMA during a 5 min incubation (TPA), *P<0.001 versus basal. A representative autoradiograph of samples from cells expressing the EGFP alone (M) or from cells expressing LPA1–EGFP receptor treated with vehicle (B) or 1 μM PMA (TPA). Upper right panel: concentration–response curve for the effect of PMA on LPA1–EGFP receptor phosphorylation; a representative autoradiograph is shown (B, basal). Lower left panel, time course of the effect of 1 μM PMA on LPA1–EGFP phosphorylation. Results are expressed as the percentage of LPA1–EGFP receptor basal phosphorylation; mean values are plotted and vertical lines represent the S.E.M. for 4–5 determinations using different cell preparations. Lower right panel: effect of 300 nM staurosporine (ST) or 1 μM bisindolylmaleimide I (BIM) on PMA-induced LPA1–EGFP receptor phosphorylation; *P<0.001 versus basal, **P<0.001 versus PMA alone; a representative autoradiograph is shown.
Figure 6
Figure 6. Homologous desensitization and effects of LPA and angiotensin II on LPA1–EGFP receptor phosphorylation
Upper panel: representative [Ca2+]i trace of cells challenged with 1 μM LPA followed by a second 1 μM LPA stimulation. Lower panel: cells were preincubated in the absence or presence of 1 μM bisindolylmaleimide for 30 min and then challenged with 100 nM angiotensin II (Ang II) or 1 μM LPA. Results are expressed as the percentage of LPA1–EGFP receptor basal phosphorylation. Mean values are plotted and vertical lines represent the S.E.M. for three determinations using different cell preparations. A representative autoradiograph is presented.
Figure 7
Figure 7. Fluorescence confocal microscopy images of cells stably expressing the EGFP or the LPA1–EGFP
Cells were incubated for 5 min in the absence of any agent and then further incubated for another 5 min in the presence of 1 μM PMA or LPA.

References

    1. van Corven E. J., Groenink A., Jalink K., Eichholtz T., Moolenaar W. H. Lysophosphatidate-induced cell proliferation: identification and dissection of signaling pathways mediated by G proteins. Cell (Cambridge, Mass.) 1989;59:45–54. - PubMed
    1. Moolenaar W. H. Mitogenic action of lysophosphatidic acid. Adv. Cancer Res. 1991;57:87–102. - PubMed
    1. Gerrard J. M., Clawson C. C., White J. G. Lysophosphatidic acids: III. Enhancement of neutrophil chemotaxis. Am. J. Pathol. 1980;100:609–618. - PMC - PubMed
    1. Lummen G., Virchow S., Rumenapp U., Schmidt M., Wieland T., Otto T., Rubben H., Jakobs K. H. Identification of G protein-coupled receptors potently stimulating migration of human transitional-cell carcinoma cells. Naunyn Schmiedebergs Arch. Pharmacol. 1997;356:769–776. - PubMed
    1. Lynch K. R., Im D. S. Life on the edg. Trends Pharmacol. Sci. 1999;20:473–475. - PubMed

Publication types

MeSH terms