. 2005 Jan;169(1):337-45.
doi: 10.1534/genetics.104.033142. Epub 2004 Sep 15.

Reversible histone acetylation and deacetylation mediate genome-wide, promoter-dependent and locus-specific changes in gene expression during plant development

Affiliations

Reversible histone acetylation and deacetylation mediate genome-wide, promoter-dependent and locus-specific changes in gene expression during plant development

Lu Tian et al. Genetics. 2005 Jan.

Abstract

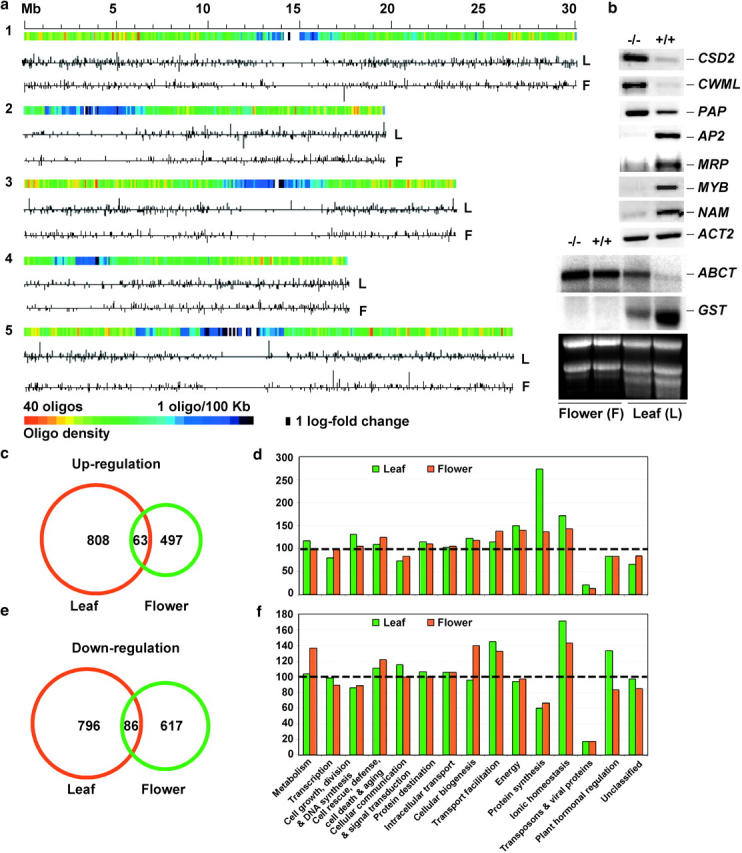
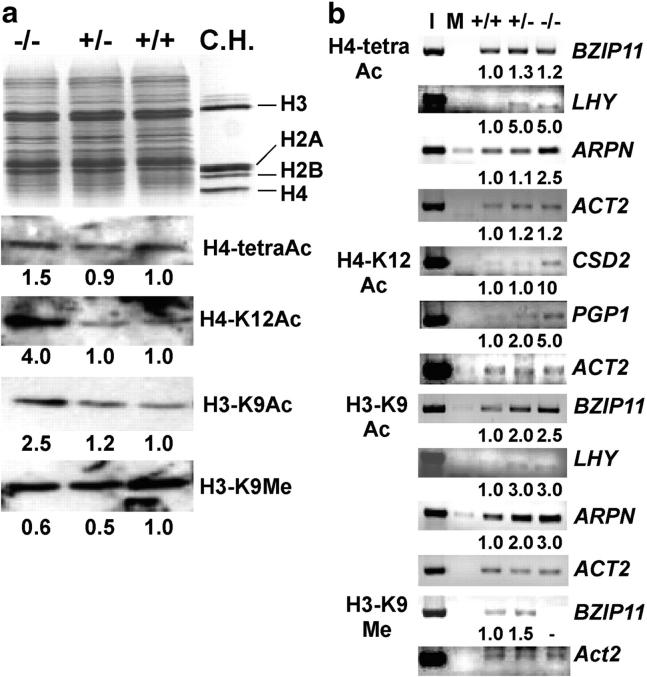
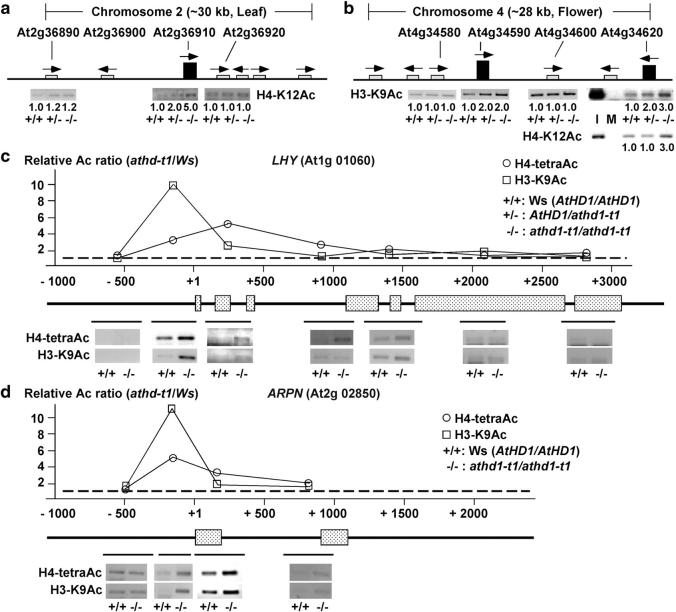
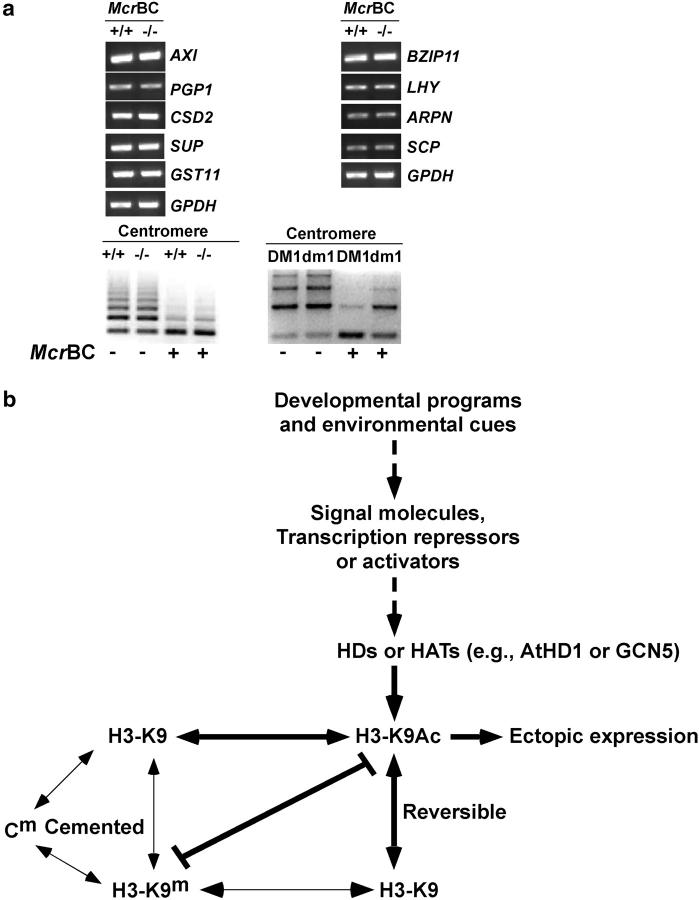
Histone acetylation and deacetylation activate or repress transcription, yet the physiological relevance of reversible changes in chromatin structure and gene expression is poorly understood. We have shown that disrupting the expression of AtHD1 that encodes a putative Arabidopsis thaliana histone deacetylase induces a variety of developmental abnormalities. However, causal effects of the AtHD1 disruption on chromatin structure and gene expression are unknown. Using Arabidopsis spotted oligo-gene microarray analysis, here we report that >7% of the transcriptome was up- or downregulated in A. thaliana plants containing a T-DNA insertion in AtHD1 (athd1-t1), indicating that AtHD1 provides positive and negative control of transcriptional regulation. Remarkably, genes involved in ionic homeostasis and protein synthesis were ectopically expressed, whereas genes in ionic homeostasis, protein transport, and plant hormonal regulation were repressed in athd1-t1 leaves or flowers, suggesting a role of AtHD1 in developmental and environmental regulation of gene expression. Moreover, defective AtHD1 induced site-specific and reversible acetylation changes in H3-Lys9, H4-Lys12, and H4 tetra-lysines (residues 5, 8, 12, and 16) in homozygous recessive and heterozygous plants. Transcriptional activation was locus specific and often associated with specific acetylation sites in the vicinity of promoters, whereas gene repression did not correlate with changes in histone acetylation or correlated directly with H3-Lys9 methylation but not with DNA methylation. The data suggest that histone acetylation and deacetylation are promoter dependent, locus specific, and genetically reversible, which provides a general mechanism for reversible gene regulation responsive to developmental and environmental changes.


Figures

F<sc>igure</sc> 1.—
Figure 1.—
(a) Chromosomal distribution of differentially expressed genes in the athd1-t1 leaves (L) and flowers (F). The 70-mer oligos were mapped in five chromosomes using the annotated gene sequences correspondent to genomic coordinates, as shown in color gradients from high (red) to low (blue) gene density. The up- and downregulated genes in the athd1-t1 lines are indicated by the vertical lines above or below the horizontal line, respectively, the length of which is proportional to natural logarithm fold changes of gene expression between the athd1-t1 and Ws lines. (b) RT-PCR and Northern blot analyses of differentially expressed genes (supplementary Tables 3 and 4 at http://www.genetics.org/supplemental/) in leaves (L) and flowers (F) of Ws and athd1-t1 lines. (c) Only 4.6% of the upregulated genes detected in the leaves and flowers overlapped. (d) The relative ratio in the y-axis was calculated using the percentage of upregulated genes from each functional category detected in the athd1-t1 lines divided by the percentage of ∼26,000 annotated genes in the same category in the genome (Arabidopsis Genome Initiative 2000). The dashed line (at 100) indicates that the percentage of all annotated genes in this functional category is equal to the percentage of the genes that are upregulated in the athd1-1 lines. (e) Only 5.7% of the downregulated genes detected in the leaves and flowers overlapped. (f) The percentages of downregulated genes detected were analyzed using the same method as in d.
F<sc>igure</sc> 2.—
Figure 2.—
Effects of athd1-t1 on histone acetylation, methylation, and gene expression. (a) H3-K9Ac, H4-tetraAc, and K12Ac were hyperacetylated and H3-K9 was hypomethylated in athd1-t1 lines. The ratios indicate relative abundance of proteins in the athd-t1 homozygous (−/−) and heterozygous (+/−) plants compared to Ws (+/+). C.H., purified core histones. (b) ChIP assays show a correlation of histone acetylation and methylation with gene activation and silencing, respectively. Semiquantitative PCR was used to estimate relative enrichment of DNA fragments in the chromatin immunoprecipitates by specific antibodies as shown. ACT2 was amplified as a control for DNA quantification. Input (I) and mock (M) indicate PCR products amplified using the DNA recovered from the chromatin complexes before ChIP analysis and without antibodies, respectively. Fold changes in the heterozygous and homozygous plants relative to the wild type are shown under each lane, except for no changes (ACT2) or a missing sample (BZIP11, H3-K9Me). ACT2 was slightly hyperacetylated in the athd1-t1 lines.
F<sc>igure</sc> 3.—
Figure 3.—
The effects of athd1-t1 on histone acetylation in chromosomal domains and within a locus. (a) An ∼30-kb segment of chromosome 2 contains the At2g36910 locus that was upregulated in the leaves. The arrows and boxes indicate the directions and levels of gene expression. ChIP assays showed that locus At2g36910 was hyperacetylated whereas two neighboring loci, At2g36890 and At2g36920, were not affected in the athd1-t1 line. (b) ChIP analysis of an ∼28-kb segment of chromosome 4. The two loci (At4g34590 and 34620) were hyperacetylated and upregulated in the flowers. Acetylated levels of the loci flanking or between the two upregulated genes remained unaffected. Input (I) and mock (M) controls are shown for At4g34620. Fold changes in +/− and −/− lines relative to the wild type are shown below each lane. (c) Histone acetylation in the promoter region is associated with gene activation. The diagram shows the genomic sequence of LHY (At1g016060), including the start codon (ATG, +1), exons (boxes), and introns (lines). ChIP was performed using antibodies against H4-tetraAc and H3-K9Ac. Solid lines below the genomic diagram indicate the location of amplified PCR fragments. The amount of PCR products relative to the ACT2 control was quantified and is shown as a histogram. (d) The same ChIP analysis in c performed for ARPN (At2g02850).
F<sc>igure</sc> 4.—
Figure 4.—
DNA methylation in athd1-t1 lines and a model for the role of histone acetylation and deacetylation in plant development. (a) DNA methylation was not affected in genes that were up- or downregulated by histone acetylation or methylation. As a control, centromeric repeats were demethylated in the ddm1 mutant but not in the athd1-t1 line. (b) A simple model indicates that reversible modifications of histone acetylation and deacetylation provide a flexible regulatory system for changes in gene expression in response to developmental programs and environmental cues. The developmental and environmental signals are perceived by signal molecules, transcriptional activators, and repressors that recruit HATs (e.g., GCN5) and HDs (e.g., AtHD1, RPD3), respectively, resulting in changes in histone acetylation or deacetylation (e.g., H3-K9), which lead to transcriptional activation or repression. These changes are reversible when the signals are absent, although changes in histone acetylation/deacetylation are coupled with other cemented changes in histone or DNA methylation as previously reviewed (Jenuwein and Allis 2001; Richards and Elgin 2002), which may induce other epigenetic lesions. Thick, dashed, and thin arrows/lines indicate the interactions that are supported by the results from this report, this and other studies, and previous work, respectively (see text).

References

    1. Alland, L., R. Muhle, H. Hou, Jr., J. Potes, L. Chin et al., 1997. Role for N-CoR and histone deacetylase in Sin3-mediated transcriptional repression. Nature 387: 49–55. - PubMed
    1. Arabidopsis Genome Initiative, 2000. Analysis of the genome sequence of the flowering plant Arabidopsis thaliana. Nature 408: 796–815. - PubMed
    1. Aufsatz, W., M. F. Mette, J. van der Winden, M. Matzke and A. J. Matzke, 2002. HDA6, a putative histone deacetylase needed to enhance DNA methylation induced by double-stranded RNA. EMBO J. 21: 6832–6841. - PMC - PubMed
    1. Ausin, I., C. Alonso-Blanco, J. A. Jarillo, L. Ruiz-Garcia and J. M. Martinez-Zapater, 2004. Regulation of flowering time by FVE, a retinoblastoma-associated protein. Nat. Genet. 36: 162–166. - PubMed
    1. Bernstein, B. E., J. K. Tong and S. L. Schreiber, 2000. Genome-wide studies of histone deacetylase function in yeast. Proc. Natl. Acad. Sci. USA 97: 13708–13713. - PMC - PubMed

Publication types

MeSH terms