. 2004 Sep;114(6):784-94.
doi: 10.1172/JCI21446.

Roles of thromboxane A(2) and prostacyclin in the development of atherosclerosis in apoE-deficient mice

Affiliations

Roles of thromboxane A(2) and prostacyclin in the development of atherosclerosis in apoE-deficient mice

Takuya Kobayashi et al. J Clin Invest. 2004 Sep.

Abstract

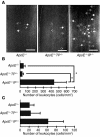
Production of thromboxane (TX) A2 and PG I2/prostacyclin (PGI2) is increased in patients with atherosclerosis. However, their roles in atherogenesis have not been critically defined. To examine this issue, we cross-bred atherosclerosis-prone apoE-deficient mice with mice deficient in either the TXA receptor (TP) or the PGI receptor (IP). Although they showed levels of serum cholesterol and triglyceride similar to those of apoE-deficient mice, apoE-/-TP-/- mice exhibited a significant delay in atherogenesis, and apoE-/-IP-/- mice exhibited a significant acceleration in atherogenesis compared with mice deficient in apoE alone. The plaques in apoE-/-IP-/- mice showed partial endothelial disruption and exhibited enhanced expression of ICAM-1 and decreased expression of platelet endothelial cell adhesion molecule 1 (PECAM-1) in the overlying endothelial cells compared with those of apoE-/-TP-/- mice. Platelet activation with thrombin ex vivo revealed higher and lower sensitivity for surface P-selectin expression in platelets of apoE-/-IP-/- and apoE-/-TP-/- mice, respectively, than in those of apoE-/- mice. Intravital microscopy of the common carotid artery revealed a significantly greater number of leukocytes rolling on the vessel walls in apoE-/-IP-/- mice than in either apoE-/-TP-/- or apoE-/- mice. We conclude that TXA2 promotes and PGI2 prevents the initiation and progression of atherogenesis through control of platelet activation and leukocyte-endothelial cell interaction.


Figures

Figure 1
Figure 1
Generation and atherosclerotic lesions of apoE_/_TP_/_ and apoE_/_IP_/_ mice. (A) Strategy for PCR analysis of WT and targeted alleles of TP and IP. Primers are shown by arrowheads. Amplified fragments are shown by broken lines. Neo, neomycin-resistance gene. (B) Representative PCR for TP and IP alleles of apoE_/_, apoE_/_TP_/_, and apoE_/_IP_/_ mice. (C) Representative oil red O staining of aortic sinus sections of apoE_/_ (middle), apoE_/_TP_/_ (lower), and apoE_/_IP_/_ (upper) mice. Scale bar: 200 μm. (D) Time course of atherosclerotic lesion development in apoE_/_ (open circles), apoE_/_TP_/_ (filled circles), and apoE_/_IP_/_ (filled squares) mice. Data are means ± SEM (n = 10 for 15-week-old apoE_/_ and apoE_/_IP_/_ and 20-week-old apoE_/_ and apoE_/_TP_/_ male mice; n = 6 for 15-week-old apoE_/_TP_/_, 20-week-old apoE_/_IP_/_, and 30-week-old apoE_/_, apoE_/_TP_/_, and apoE_/_IP_/_ mice). *P < 0.05 and **P < 0.01 versus apoE_/_ mice. (E) Representative Sudan IV staining of en face preparations of aortas from apoE_/_, apoE_/_TP_/_, and apoE_/_IP_/_ mice at 20 weeks of age. Scale bars: 2 mm. (F) Quantification of en face atherosclerotic lesions in apoE_/_, apoE_/_TP_/_ and apoE_/_IP_/_ mice at 20 weeks of age. Data are means ± SEM (n = 5 each). *P < 0.05 and **P < 0.01 for bracketed comparisons. (G) Representative hematoxylin and eosin staining of innominate artery sections of apoE_/_, apoE_/_TP_/_, and apoE_/_IP_/_ mice at 45 weeks of age. Scale bar: 20 μm. (H) Quantitative analysis of innominate atherosclerotic areas in apoE_/_, apoE_/_TP_/_, and apoE_/_IP_/_ mice at 45 weeks of age. Data are means ± SEM (n = 10 each). *P < 0.05 and **P < 0.01 for bracketed comparisons.
Figure 2
Figure 2
Effects of TP or IP deficiency on the abundance of macrophages and SMCs and EC integrity in aortic arch lesions of apoE-deficient mice at 20 weeks of age. (A) Representative immunostaining of macrophages and SMCs in aortic arch lesions of apoE_/_ (left panels), apoE_/_TP_/_ (middle panels), and apoE_/_IP_/_ (right panels) mice. Lesions were stained with specific antibodies for macrophages (MOMA-2; upper) and for SMCs (α-actin; lower). White arrowheads indicate the external elastic lamina. Scale bars: 20 μm. (B and C) Quantitative analysis of the abundance of macrophages (B) and SMCs (C) in aortic arch lesions of apoE_/_, apoE_/_TP_/_, and apoE_/_IP_/_ mice. Data are means ± SEM (n = 10 each). (D) Representative immunostaining of ECs in aortic arch lesions of apoE_/_ (left panels), apoE_/_TP_/_ (middle panels), and apoE_/_IP_/_ (right panels) mice. Cross-sections were stained with specific antibodies for ECs (vWF, upper, and PECAM-1, red, lower) and SMCs (α-actin, green, lower). Black and white arrowheads indicate the site of endothelial disruption. Scale bars: 20 μm. (E) Quantitative analysis for endothelial integrity in aortic arch lesions of apoE_/_, apoE_/_TP_/_, and apoE_/_IP_/_ mice by measurement of the vWF-positive signals overlying aortic lesions. Data are means ± SEM (n = 10 each). *P < 0.05 for bracketed comparisons. (F) Representative en face staining of aortic arch lesions of apoE_/_, apoE_/_TP_/_, and apoE_/_IP_/_ mice. En face staining of aortic arch lesions with silver nitrate or anti_PECAM-1 was performed. Scale bars: 10 μm. (G) Representative scanning electron micrographs of aortic arches of apoE_/_IP_/_ mice. The right panel shows a higher magnification of the boxed area in the left panel. Scale bars: 50 μm.
Figure 3
Figure 3
Effects of TP or IP deficiency on ICAM-1 and PECAM-1 expression in the ECs overlying atheromatous lesions of apoE-deficient mice. (A) Representative immunostaining for ICAM-1 and PECAM-1 in cross-sections from apoE_/_ (left panels), apoE_/_TP_/_ (middle panels), and apoE_/_IP_/_ (right panels) mice. Mice were sacrificed at 20 weeks of age. Cross-sections were stained with specific antibodies against ICAM-1 (red; lower panels), PECAM-1 (red; upper panels), and smooth muscle α-actin (green). Scale bars: 20 μm. (B) Representative immunostaining of aortic arch lesions and neighboring intact areas for ICAM-1 and PECAM-1 in en face preparations of apoE_/_ (left panels), apoE_/_TP_/_ (middle panels) and apoE_/_IP_/_ (right panels) mice. En face preparations were stained with specific antibodies against ICAM-1 (middle panels) and PECAM-1 (upper panels). Mice were sacrificed at 20 weeks of age. Scale bars: 10 μm. Merge, merged images. (C and D) Quantification of ICAM-1 (C) and PECAM-1 (D) expression in ECs overlying aortic arch lesions and neighboring intact areas of apoE_/_, apoE_/_TP_/_, and apoE_/_IP_/_ mice. Data are means ± SEM (n = 8 each). *P < 0.05 and **P < 0.01 for bracketed comparisons.
Figure 4
Figure 4
Platelet reactivity for thrombin-induced surface expression of P-selectin. (A) Representative histograms of thrombin-induced P-selectin expression in platelets from apoE_/_ (upper panels), apoE_/_TP_/_ (middle panels), and apoE_/_IP_/_ (lower panels) mice. Platelets were either left unstimulated or were stimulated with 0.2, 0.3, or 0.4 U/ml of thrombin. They were then labeled with FITC-conjugated anti_P-selectin and were analyzed by flow cytometry. Filled histograms indicate background signal. (B) Quantification analysis. Concentration-dependent effect of thrombin for P-selectin expression was determined in platelets from apoE_/_ (open circles), apoE_/_TP_/_ (filled circles), and apoE_/_IP_/_ (filled squares) mice. Data are means ± SEM (n = 9 each). *P < 0.05 and **P < 0.01 versus apoE_/_ mice.
Figure 5
Figure 5
Intravital microscopy for leukocyte rolling and adhesion. (A) Fluorescence images of rolling and adherent leukocytes. Black and white arrows indicate rolling and adherent leukocytes, respectively. Vessel lumens are outlined by broken lines. Scale bars: 0.1 mm. (B) Quantitative analysis of rolling leukocytes. Data are means ± SEM (n = 5 each). *P < 0.05 versus apoE_/_ and apoE_/_TP_/_ mice. (C) Quantitative analysis for adherent leukocytes as described in B.

Similar articles

Cited by

References

    1. Ross R. Atherosclerosis is an inflammatory disease. Am. Heart. J. 1999;138:S419–S420. - PubMed
    1. FitzGerald GA, Smith B, Pedersen AK, Brash AR. Increased prostacyclin biosynthesis in patients with severe atherosclerosis and platelet activation. N. Engl. J. Med. 1984;310:1065–1068. - PubMed
    1. Belton O, Byrne D, Kearney D, Leahy A, Fitzgerald DJ. Cyclooxygenase-1 and -2-dependent prostacyclin formation in patients with atherosclerosis. Circulation. 2000;102:840–845. - PubMed
    1. Plump AS, et al. Severe hypercholesterolemia and atherosclerosis in apolipoprotein E-deficient mice created by homologous recombination in ES cells. Cell. 1992;71:343–353. - PubMed
    1. Zhang SH, Reddick RL, Piedrahita JA, Maeda N. Spontaneous hypercholesterolemia and arterial lesions in mice lacking apolipoprotein E. Science. 1992;258:468–471. - PubMed

Publication types

MeSH terms