

Complete genomic sequence of bacteriophage B3, a Mu-like phage of Pseudomonas aeruginosa
- PMID: 15375138
- PMCID: PMC516594
- DOI: 10.1128/JB.186.19.6560-6574.2004
Complete genomic sequence of bacteriophage B3, a Mu-like phage of Pseudomonas aeruginosa
Abstract
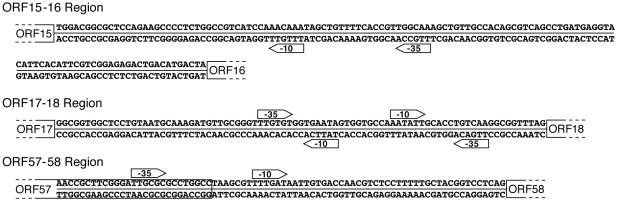
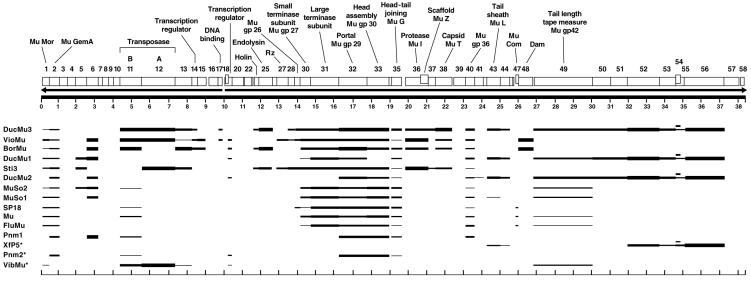
Bacteriophage B3 is a transposable phage of Pseudomonas aeruginosa. In this report, we present the complete DNA sequence and annotation of the B3 genome. DNA sequence analysis revealed that the B3 genome is 38,439 bp long with a G+C content of 63.3%. The genome contains 59 proposed open reading frames (ORFs) organized into at least three operons. Of these ORFs, the predicted proteins from 41 ORFs (68%) display significant similarity to other phage or bacterial proteins. Many of the predicted B3 proteins are homologous to those encoded by the early genes and head genes of Mu and Mu-like prophages found in sequenced bacterial genomes. Only two of the predicted B3 tail proteins are homologous to other well-characterized phage tail proteins; however, several Mu-like prophages and transposable phage D3112 encode approximately 10 highly similar proteins in their predicted tail gene regions. Comparison of the B3 genomic organization with that of Mu revealed evidence of multiple genetic rearrangements, the most notable being the inversion of the proposed B3 immunity/early gene region, the loss of Mu-like tail genes, and an extreme leftward shift of the B3 DNA modification gene cluster. These differences illustrate and support the widely held view that tailed phages are genetic mosaics arising by the exchange of functional modules within a diverse genetic pool.
Figures

References
-
- Abraham, W. R., B. Nogales, P. N. Golyshin, D. H. Pieper, and K. N. Timmis. 2002. Polychlorinated biphenyl-degrading microbial communities in soils and sediments. Curr. Opin. Microbiol. 5:246-253. - PubMed
-
- Akhverdyan, V. Z., E. A. Khrenova, M. A. Reulets, T. V. Gerasimova, and V. N. Krylov. 1985. Characterization of transposon phages of Pseudomonas aeruginosa belonging to two groups differing in DNA-DNA homology. Genetika 21:735-746. - PubMed
-
- Akhverdyan, V. Z., E. A. Khrenova, V. G. Bogush, T. V. Gerasimova, N. B. Kirsanov, and V. N. Krylov. 1984. Wide distribution of transposable phages in natural populations of Pseudomonas aeruginosa. Genetika 20:1612-1619. - PubMed
-
- Altschul, S. F., W. Gish, W. Miller, E. W. Myers, and D. J. Lipman. 1990. Basic local alignment search tool. J. Mol. Biol. 215:403-410. - PubMed
Publication types
MeSH terms
Substances
Associated data
- Actions
LinkOut - more resources
Full Text Sources
Other Literature Sources
Molecular Biology Databases
Research Materials
