. 2004 Sep 28;101(39):14198-203.
doi: 10.1073/pnas.0406138101. Epub 2004 Sep 16.

The human BCL6 transgene promotes the development of lymphomas in the mouse

Affiliations

The human BCL6 transgene promotes the development of lymphomas in the mouse

Beverly W Baron et al. Proc Natl Acad Sci U S A. .

Abstract

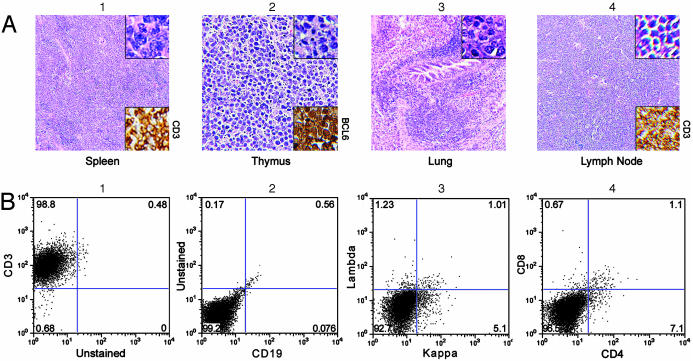
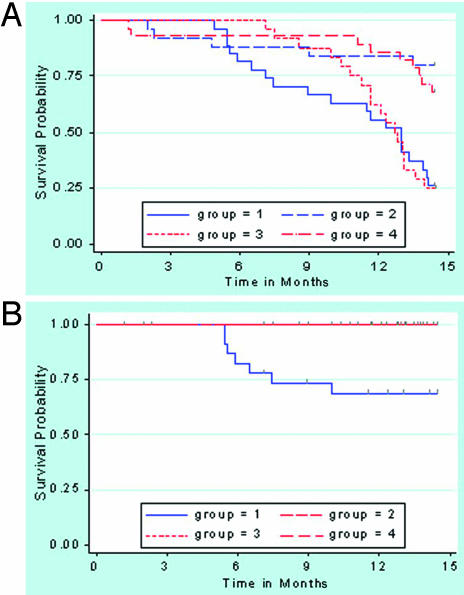
BCL6, a gene on chromosome 3, band q27, encodes a zinc finger transcriptional repressor that is needed for germinal center formation and has been implicated in the pathogenesis of some human lymphomas when it is mutated or involved in chromosomal rearrangements. To explore further the mechanisms of action of BCL6 in lymphomagenesis, we developed a transgenic mouse model mimicking a common translocation, the t(3, 14)(q27;q32), in human lymphomas. The transgenic mice develop normally and express the transgenic BCL6 protein constitutively in lymphocytes. A small fraction of the animals develop B and T cell lymphomas after a long latency period, but the incidence is dramatically enhanced following administration of N-ethyl-N-nitrosourea, a carcinogen that induces DNA mutations. The N-ethyl-N-nitrosourea-induced lymphomas spread widely, were exclusively T cell, expressed the BCL6 protein, and occurred only in the transgenic mice. Because BCL6 expression has been reported in a number of T cell tumors as well as in the more commonly occurring B cell lymphomas in humans, our transgenic mice provide a model for the study of human lymphomas.


Figures

Fig. 1.
Fig. 1.
RT-PCR of RNA. Reverse transcription lanes are marked +; – lanes indicate no reverse transcription using same primers as in preceding lane. (a Upper) Lanes A, 1 kb plus DNA ladder; B, RT-PCR with construct primers that amplify 289 bp from tail (genomic) DNA; C, 1 kb plus ladder; D, RT-PCR, cDNA from spleen (SPL) of study (S) mouse (transgenic) reveals the 223-bp band expected when the 66-bp intron is spliced out; F–I, SPL cDNA of control (C) mice containing only BCL6 (lane F) or Eμ-tTA transgene (lane H), as expected, no band is found; J, thymus (THY), S mouse, shows expected splice; L, different primer pair in transgene 5′ to intron reveals 170-bp band and, as expected, is the same size in genomic DNA (lane O); P and V, cDNA from flow-sorted (>99% pure) B cells (lane P) and T cells (lane V) from spleen reveals partial splicing with original primer pair. (b Upper) Construct primers spanning intron. Lanes C–F, RT-PCR, cDNA of SPL and THY from 2 S mice on doxycycline (Sd) show down-regulation of transgene expression; H, kidney, S mouse, as expected, no transgene expression was found; L, cDNA from SPL, S mouse with B cell lymphoma (SL), shows splice; lane O, SPL of C mouse with lymphoma (CL), as expected, no band was found. (a Lower and b Lower) RT-PCR with β-actin primers shows cDNA (285-bp band) in each lane (+) where reverse transcriptase was added.
Fig. 2.
Fig. 2.
β-Gal staining of mouse thymus and spleen. (A) Representative cut tissue pieces of thymus (Upper) and spleen (Lower) from study (S) mice (transgenic) stain deeply blue-green as compared with minimal background staining in controls (C). (BD) Microsopic analysis of thymus (B) and spleen (C) from transgenic mice reveal the blue-green cytoplasmic staining expected with X-gal, whereas tissues from control mice do not stain (D). Sections are counterstained with nuclear fast red.
Fig. 3.
Fig. 3.
Immunohistochemistry. Paraffin-embedded sections of spleen stained with rabbit polyclonal antibodies to N-terminal BCL6 are shown. The nuclei in the lymphocytes of the transgenic mouse spleen (Left) stain brown, indicating that they are positive for BCL6 (23-day-old spleen containing mostly white pulp), whereas the cells in the wild-type mouse spleen (Right) do not recognize anti-BCL6.
Fig. 4.
Fig. 4.
B cell lymphoma. (A)(1) Hematoxylin/eosin stains reveal that the structure of the spleen is effaced with a mixture of small, medium, and large tumor cells that stain for BCL6 (Lower Inset). (2) Paratrabecular tumor nodules are present in the bone marrow. (3 and 4) Tumor cells infiltrate the liver (3) and partially efface a mesenteric lymph node (4). (Original magnifications, ×100 in A and ×300 in Insets.) (B) FACS shows the tumor is B cell, because most of the cells stain with anti-B220 (3). They are kappa positive (4). Staining is positive for IgG (6) and IgD (7) but not IgM (5). T cells are present in reduced numbers (2), but the CD4/CD8 ratio is normal (8).
Fig. 5.
Fig. 5.
T cell lymphomas. (A) Hematoxylin/eosin-stained sections show that the architecture of the spleen (1), thymus (2), and mesenteric lymph node (4) are effaced with pleomorphic small to medium-sized tumor cells that also infiltrate the lung (3). Images in 1 and 3 are from the same mouse, whereas images in 2 and 4 are from a different mouse. The tumors stain with anti-CD3 (Lower Insets in 1 and 4) and are BCL6-positive (Lower Inset in 2). They often show a starry sky pattern (4). (Original magnifications, ×75 in 1, 3, and 4, ×200 in 2, ×500 in Upper Inset of 1, ×300 in Upper Insets of 2-4.) (B) FACS confirms the tumors consist of T cells, because they stain with anti-CD3 (1) but not with anti-CD19 (2) or antibodies to kappa/lambda (3). They are CD4,CD8 (4).
Fig. 6.
Fig. 6.
Kaplan–Meier curves. (A) Curve of overall survival shows that the survival probability was not significantly different between the mice in the ENU-treated groups (transgenics, group 1; controls, group 3) or between those in the PBS-treated groups (transgenics, group 2; controls, group 4). The survival probability was lower in the ENU groups compared with the PBS-treated groups (all P ≤ 0.001). (B) Curve of death from lymphomas, which occurred only in ENU-treated transgenics (group 1), and was significantly higher than in any other group (all P≤ 0.005).

Similar articles

Cited by

References

    1. Baron, B. W., Nucifora, G., McCabe, N., Espinosa, R., III, Le Beau, M. M. & McKeithan, T. W. (1993) Proc. Natl. Acad. Sci. USA 90, 5262–5266. - PMC - PubMed
    1. Ye, B. H., Lista, F., LoCoco, F., Knowles, D. M., Offit, K., Chaganti, R. S. K. & Dalla-Favera, R. (1993) Science 262, 747–750. - PubMed
    1. Ye, B. H., Chaganti, S., Chang, C.-C., Niu, H., Corradini, P., Chaganti, R. S. K. & Dalla-Favera, R. (1995) EMBO J. 14, 6209–6217. - PMC - PubMed
    1. Pasqualucci, L., Migliazza, A., Basso, K., Houldsworth, J., Chaganti, R. S. K. & Dalla-Favera, R. (2003) Blood 101, 2914–2923. - PubMed
    1. Dent, A. L., Shaffer, A. L., Yu, X., Allman, D. & Staudt, L. M. (1997) Science 276, 589–592. - PubMed

Publication types

MeSH terms

LinkOut - more resources