

Three dimensional analysis of the lamina cribrosa in glaucoma
- PMID: 15377555
- PMCID: PMC1772339
- DOI: 10.1136/bjo.2003.036020
Three dimensional analysis of the lamina cribrosa in glaucoma
Abstract
Background/aim: Structural changes in the lamina cribrosa have been implicated in the pathogenesis of glaucomatous optic atrophy. The aim of this study was to determine a measure the surface variability of the cup floor in normal subjects and patients with glaucoma.
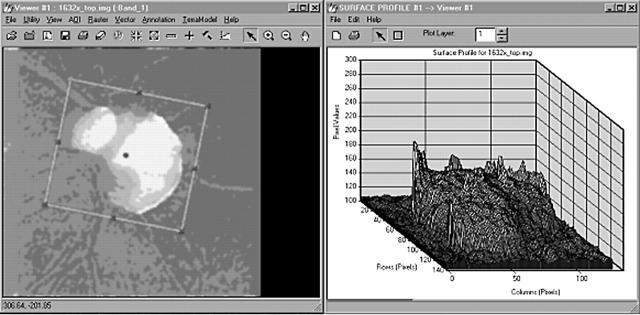
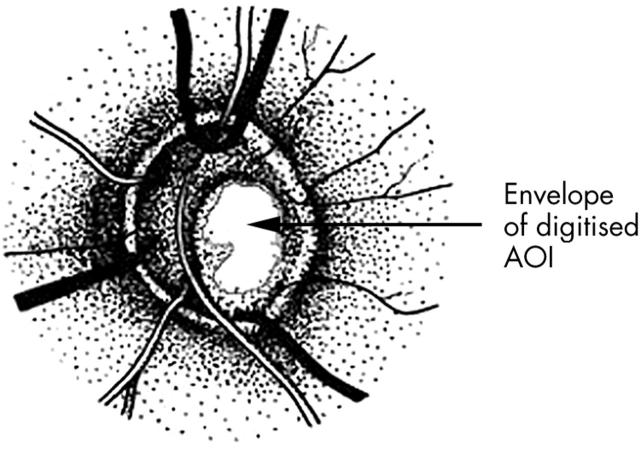
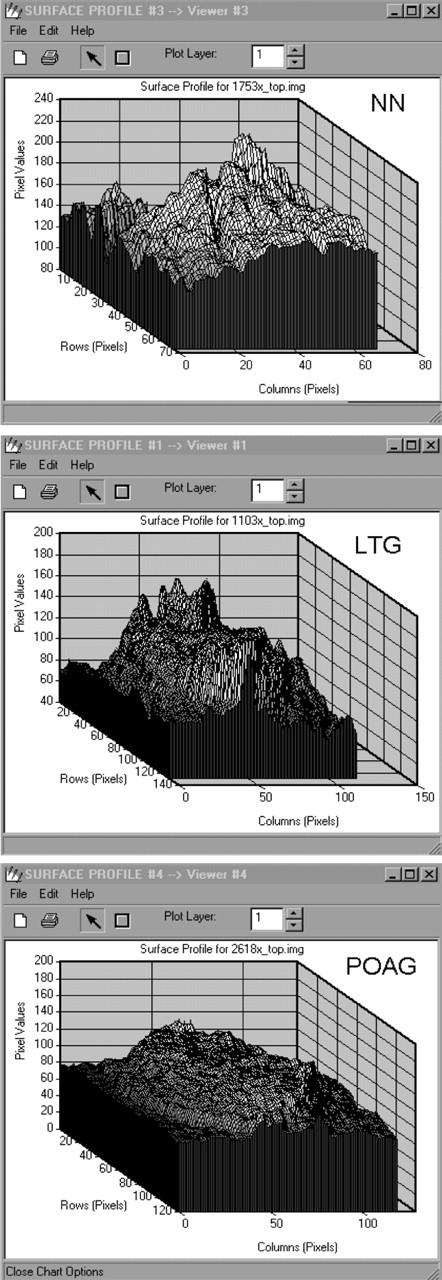
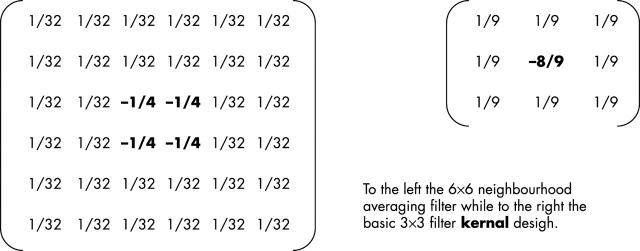
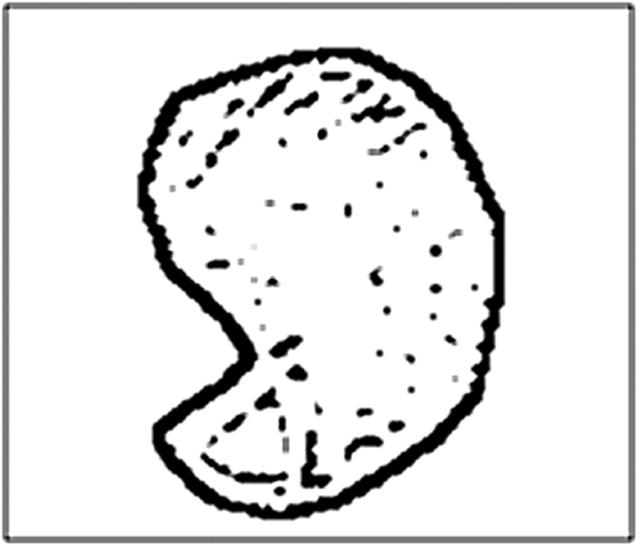
Methods: A sample of age matched normal subjects (NN), patients with low tension glaucoma (LTG), and primary open angle glaucoma (POAG) were included in the study. The glaucoma groups were matched for the severity of the visual field loss. Mean 10 degree topographic images of normal and glaucomatous eyes from the Heidelberg retina tomograph were imported into ERDAS image processing software where topographic analysis of the cup floor could be assessed. Each image was processed using customised spatial filters that calculated the surface depth variation in localised neighbourhood areas across each image. The local change in depth across the cup floor surface was determined and compared between the three clinical groups.
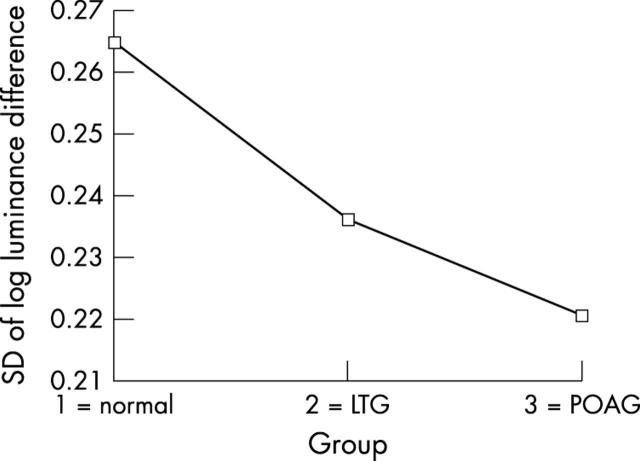
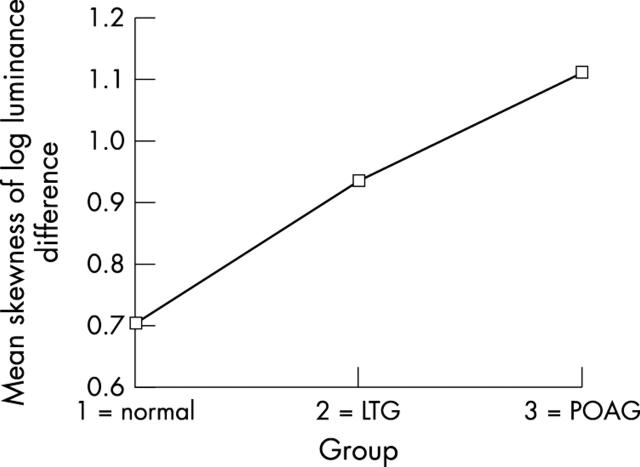
Results: The depth variation in the cup floor was largest in normal subjects followed by LTG and POAG. Highly statistically significant differences in surface depth variability of the cup floor existed between normal and LTG (p = 0.005), between normal and POAG (p<0.0001), and between LTG and POAG groups (p<0.0001). The variability and skewness of depth difference across the optic cup floor were also significantly different between the three clinical groups.
Conclusion: A new parameter quantifying depth variations in the cup floor significantly discriminated between groups of normal and glaucoma patients. This new parameter may contribute to a better understanding of the pathogenesis of the glaucomatous optic nerve damage in different types of glaucoma.
Figures
References
-
- Minkler DS, Bunt AH, Johanson GW. Orthograde and retrograde axoplasmic transport during acute ocular hypertension in the monkey. Invest Ophthalmol Vis Sci 1977;16:426–41. - PubMed
-
- Quigley HA, Anderson DR. The dynamics and location of axonal transport blockage by acute intraocular pressure elevation in primate optic nerve. Invest Ophthalmol Vis Sci 1976;15:606–16. - PubMed
-
- Quigley HA, Hohman R, Addicks EM, et al. Morphologic changes in the lamina cribrosa correlated with neural loss in open angle glaucoma. Am J Ophthalmol 1983;95:673–91. - PubMed
-
- Fitzke FW, Masters BR. Three dimensional visualisation of confocal sections of human fundus and optic nerve. Curr Eye Res 1993;12:1015–18. - PubMed
-
- Miller KM, Quigley HA. The clinical appearance of the lamina cribrosa as a function of the extent of glaucomatous optic nerve damage. Ophthalmology 1988;95:135–8. - PubMed
Publication types
MeSH terms
LinkOut - more resources
Full Text Sources
Medical