

Effect of prior cognitive state on resting state networks measured with functional connectivity
- PMID: 15382248
- PMCID: PMC6871664
- DOI: 10.1002/hbm.20069
Effect of prior cognitive state on resting state networks measured with functional connectivity
Abstract
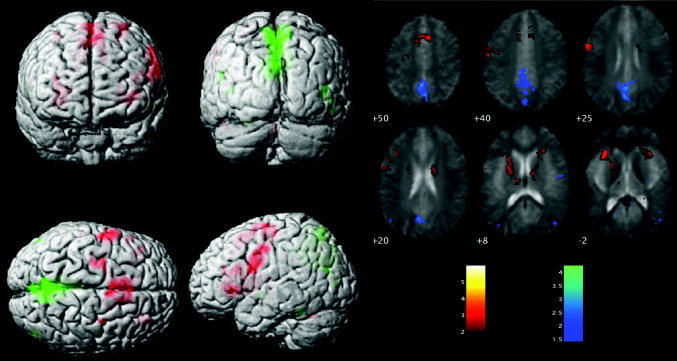
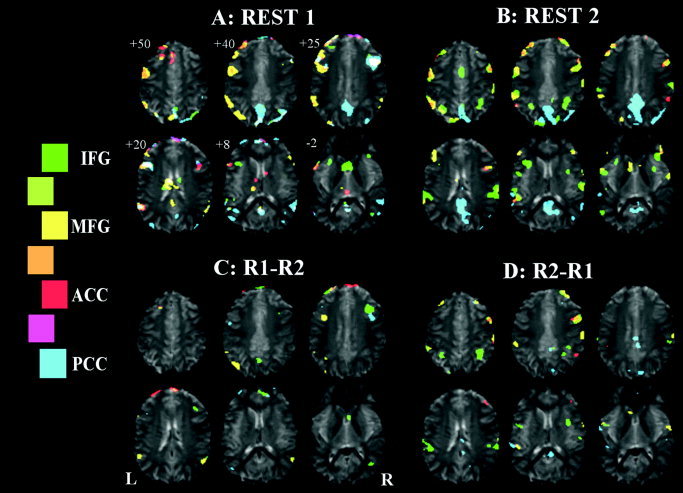
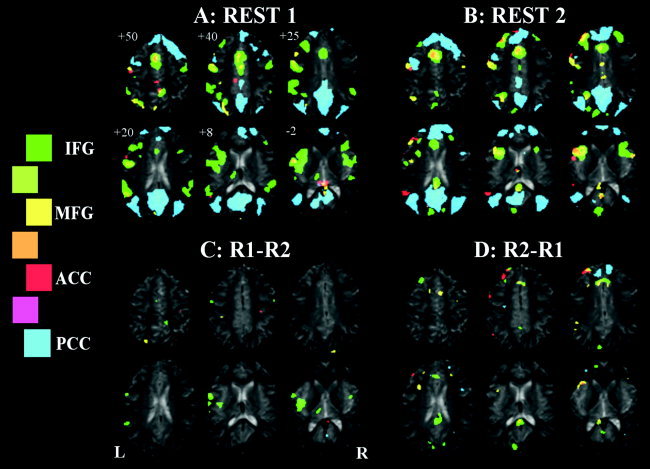
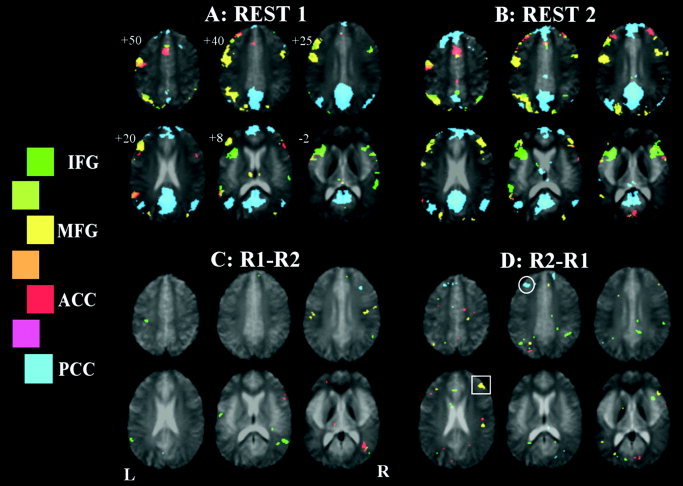
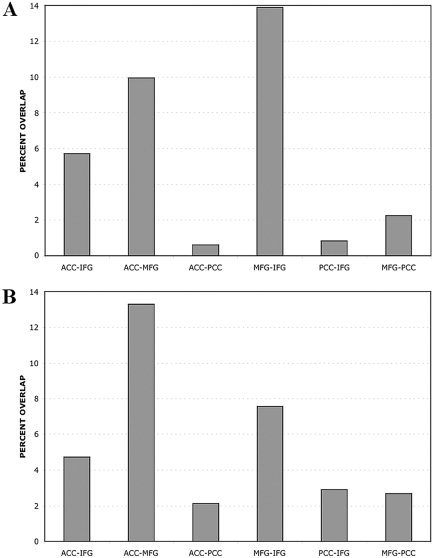
To address the extent to which functional connectivity measures an absolute brain state, we observed the effect of prior performance of a language task on resting-state networks in regions associated with language. Six subjects were imaged during rest before and after a block-design language task. Connectivity maps were generated for each of four language regions (identified from analysis of the language activation portion of the study) in each subject for both rest periods. Conjunction analysis demonstrated distinct networks of voxels for each seed region, indicating separate functional subnetworks associated with the different regions. In a comparison of rest before and after the activation task widespread and significant changes were observed in all individuals, suggesting that the measured resting state network reflects a dynamic image of the current brain state. At the group level, an extended network was observed that was largely persistent over time. Even at the group level an increase in connectivity was observed between left and right middle frontal gyri, and between posterior cingulate cortex and medial frontal cortex in the rest after the language task. These results suggest that functional connectivity may be a powerful measure of cognitive state, sensitive to differences between controls and patients together with the particular cognitive processing occurring during the rest state.
(c) 2004 Wiley-Liss, Inc.
Figures
References
-
- Abbott D, Jackson G (2001): iBrain–software for analysis and visualisation of functional MR images. Neuroimage 13: 59.
-
- Andreasen NC, O'Leary DS, Cizadlo T, Arndt S, Rezai K, Watkins GL, Ponto LL, Hichwa RD (1995): Remembering the past: two facets of episodic memory explored with positron emission tomography. Am J Psychiatry 152: 1576–1585. - PubMed
-
- Binder JR, Frost JA, Hammeke TA, Bellgowan PS, Rao SM, Cox RW (1999): Conceptual processing during the conscious resting state. A functional MRI study. J Cogn Neurosci 11: 80–95. - PubMed
-
- Biswal B, Yetkin FZ, Haughton VM, Hyde JS (1995): Functional connectivity in the motor cortex of resting human brain using echo‐planar MRI. Magn Reson Med 34: 537–541. - PubMed
-
- Cabeza R, Nyberg L (2000): Imaging cognition. II: An empirical review of 275 PET and fMRI studies. J Cogn Neurosci 12: 1–47. - PubMed
MeSH terms
LinkOut - more resources
Full Text Sources
