. 2004 Sep 22;24(38):8265-77.
doi: 10.1523/JNEUROSCI.2635-04.2004.

Theta-modulated place-by-direction cells in the hippocampal formation in the rat

Affiliations

Theta-modulated place-by-direction cells in the hippocampal formation in the rat

Francesca Cacucci et al. J Neurosci. .

Abstract

We report the spatial and temporal properties of a class of cells termed theta-modulated place-by-direction (TPD) cells recorded from the presubicular and parasubicular cortices of the rat. The firing characteristics of TPD cells in open-field enclosures were compared with those of the following two other well characterized cell classes in the hippocampal formation: place and head-direction cells. Unlike place cells, which code only for the animal's location, or head-direction cells, which code only for the animal's directional heading, TPD cells code for both the location and the head direction of the animal. Their firing is also strongly theta modulated, firing primarily at the negative-to-positive phase of the locally recorded theta wave. TPD theta modulation is significantly stronger than that of place cells. In contrast, the firing of head-direction cells is not modulated by theta at all. In repeated exposures to the same environment, the locational and directional signals of TPD cells are stable. When recorded in different environments, TPD locational and directional fields can uncouple, with the locational field shifting unpredictably ("remapping"), whereas the directional preference remains similar across environments.


Figures

Figure 7.
Figure 7.
The firing of TPD cells is strongly modulated by theta. A, Example of TPD firing in relation to the theta EEG oscillation. Three seconds of representative data are shown, with the EEG trace on top and the spike occurrence on the bottom. The gray curves indicate where EEG traces were fitted to half-sinusoids, and the black ticks indicate spike occurrence. TPD cell spikes tend to occur at the trough of the local theta wave. B, Autocorrelation histograms for ±500 msec period for one PC (PC 10), three TPD cells (TPD a26, d2, and f5), and one HD cell (HD f6). C, Phase preference histograms (same cells as B). Histograms show spike frequency relative to the local EEG phase, in 20° bins. 90° represents the trough, and 270° represents the peak, of the fitted theta wave. The 95% confidence interval is shown in gray. Concentration values, used as a measure of rhythmicity, are shown on the top right of each histogram. D, Theta rhythmicity for several cell types in the septohippocampal system. Bar chart shows mean ± SE concentration values for each cell type. DBB, Diagonal band of Broca. Error bars refer to SE concentration values. For details of cell types and recording procedures, see Materials and Methods. E, Mean theta phase angle of the three cell types. The mean phase angle is derived for each cell and then averaged and shown as histograms for PCs (left), TPD cells (middle), and HD cells (right). F, Schematic diagram of results from E. PCs and TPD cells show a preference ∼200° and 80°, respectively. Note that no direct comparison between the phase preference of TPD and PCs is possible, because no common EEG reference was recorded.
Figure 4.
Figure 4.
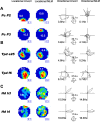
Effects of the MLM correction on the locational and directional firing of two PCs (A), two TPD cells (B), and two HD cells (C). Locational firing-rate maps are shown in the left two columns, and directional polar plots are shown in the right two columns. In each category of locational and directional firing, the left column shows uncorrected (Uncorr) plots, and the right column (MLM) shows plots calculated by applying the MLM correction algorithm (see Materials and Methods). Numbers in white in the locational maps and in black at the bottom left corner of the polar plots refer to peak firing rate (in hertz). Numbers in blue are as in Figure 2. Small dwell-time polar plots (bottom right of rate polar plots) are as in Figure 2. Mean correlation r values between uncorrected and MLM corrected maps are as follows: location, HD, 0.48; TPD, 0.72; PC, 0.96; direction, HD, 0.99; TPD, 0.95; PC, 0.74. Despite the ceiling effect of the directional r values, it can be seen that PCs show a robust locational effect (i.e., undiminished by MLM), HD cells show a robust directional effect, and TPD cells show both.
Figure 5.
Figure 5.
The locational fields of HD cells, but not TPD cells or PCs, are artifactual. Boxplots showing the distribution of locational field peaks in the cylinder for each cell group (PC in white; TPD in black; HD with diagonal stripes), before (A) and after (B) applying the MLM correction. On the y-axis, the radial distance from the center of the locational peaks is expressed as a proportion (center, 0; edge, 1). Note the large change in location for HD cells. The box represents the interquartile range. The whiskers are lines that extend from the box to the highest and lowest values, excluding outliers. A line across the box indicates the median.
Figure 1.
Figure 1.
PCs (stars), TPD cells (circles), and HD cells (triangles) can be classified on the basis of their spatial and temporal firing characteristics: x-axis, locational information (corrected using MLM); y-axis, directional information (corrected using MLM); and z-axis, theta modulation index. The gray shade of each symbol indicates its position on the z-axis, shown by the grayscale indicator bar alongside the z-axis. The ranges and means for the three groups are as follows: locational information, PC, 0.37-2.32, mean of 1.27; TPD, 0.10-1.30, mean of 0.49; HD, 0.04-0.98, mean of 0.27; directional information, PC, 0.04-0.59, mean of 0.26; TPD, 0.10-1.54, mean of 0.74; HD, 0.45-2.82, mean of 1.31; theta modulation, PC,-0.05-0.96, mean of 0.31; TPD, 0.07-1.00, mean of 0.58; HD, -0.28 - 0.23, mean of -0.06.
Figure 2.
Figure 2.
Firing of TPD cells is modulated by both location and head direction. A, Locational firing-rate maps for cell TPD f3. Central firing-rate map is direction independent. Surrounding rate maps show locational firing for specific head directions only (in 45° bins). Black numbers refer to peak firing rate (in hertz), and blue numbers in blue boxes refer to the mean rate of the dark blue area of the map (0-20% of peak firing rate; in hertz). All maps are individually autoscaled. B, Directional polar plot showing that cell TPD f3 fires maximally when the rat faces southwest. Number refers to peak firing rate. Bottom right, Directional dwell-time polar plot (in seconds). C, Locational and directional firing-rate maps of four representative TPD cells. Data refers to 8 min recording sessions, in the canonical cylindrical environment. For each cell, the locational firing-rate map (left; white number refers to peak firing rate; blue number is as in A; both in hertz) and the directional polar plot (right) are shown. The bottom right of each rate polar plot indicates the directional dwell-time polar plot (in seconds).
Figure 3.
Figure 3.
TPD firing is modulated by both location and direction. A, Mean ± SE bar graphs for directional (left) and locational (right) distributive ratios across the three cell types. TPD locational and directional firing cannot be successfully predicted using the distributive hypothesis procedure, indicating that both variables have an influence on the firing of the cells. B, Mean ± SE bar graphs for the corrected directional (left) and locational (right) information values across the three cell types. TPD cells have intermediate values of both locational and directional information to those of PC and HD cells. **p < 0.01 indicates significant difference between groups.
Figure 6.
Figure 6.
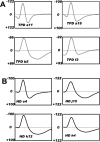
Representative waveforms of four TPD (A) and four HD (B) cells. The y-axis scale denotes microvolts (negative up), and the horizontal line through 0 denotes the resting or baseline potential. The length of the x-axis represents 1 msec. The waveforms of most TPD cells show a short late-positive potential (see TPD a11, a18, f3, and HD e4), whereas those of HD cells are mostly pyramidal-like, with a long positive potential (see HD k12, j15, h4, and TPD b5).
Figure 8.
Figure 8.
Firing-rate maps for four TPD cells comparing locational firing in each of the three different environments (cylinder, square, and open platform). Locational firing is reproducible across similarly shaped environments (baseline and second cylinder). In general, locational fields of TPD cells are similar across the cylinder and square but differ (“remap”) between cylinder and open platform (see cells TPD f6 and f4; but for exceptions, see cells TPD e3 and TPD f3). For each cell, four untransformed and two topologically transformed firing-rate maps are presented. For square and open platform, topologically transformed maps are shown to the right of untransformed maps in the given environment. Correlation values, comparing with baseline cylinder, are shown in black, at the top right of transformed square, transformed open platform, and second cylinder firing-rate maps. Numbers in blue are as in Figure 2.
Figure 9.
Figure 9.
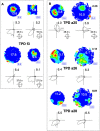
Similarity of preferred direction in different environments, despite remapping of preferred locational firing. A, B, For each TPD cell within each panel, locational firing is represented by firing-rate map (top) and directional firing by polar plot (bottom). Small polar plots (bottom right of each main polar plot) are as in Figure 2. Numbers in blue are as in Figure 2. A, TPD cell firing in canonical cylinder (top left), square (top right), open platform (bottom left), and second cylinder (bottom right) trials. B, Three simultaneously recorded TPD cells in the canonical cylinder (left) and open platform (right). Note that the similarity of TPD cell directional preference in different environments extends to those environments in which locational remapping is seen. Correlation values, compared with baseline cylinder, are shown in black at the top right of open platform locational maps.
Figure 10.
Figure 10.
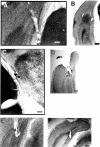
Photomicrographs of coronal sections showing electrode tracks in dorsal presubiculum and dorsal parasubiculum. A, Animal c. Electrode track through presubiculum (TPD c1). Scale bar, 310 μm. B, Animal d (left hemisphere). TPD d1 was recorded from the more lateral track of the two shown, from the superficial layers of either presubiculum or parasubiculum. Scale bar, 650 μm. C, Animal d (right hemisphere). TPD d2 was recorded from the more ventrolateral track of the two, from the superficial layers of caudal parasubiculum. Scale bar, 310 μm. D, Animal e. Large electrode track area made by four closely appositioned tetrodes. Tetrode tips are located in the deep layers of presubiculum. Before the animal's death, the electrodes were lowered 1 mm beyond the last TPD cell recording site. TPD cells may have been recorded from white matter dorsal to the presubiculum. Scale bar, 675 μm. E, Animal f. TPD and HD cells were recorded from both the lateral and medial tetrodes in layers III-VI of the presubiculum. Scale bar, 340 μm. F, Animal f. This section is ∼280 μm anterior in the fixed brain to that in E. TPD f1 was recorded from this tetrode in the deep layers of presubiculum. Scale bar, 680 μm.

References

    1. Barnes CA (1988) Spatial learning and memory processes: the search for their neurobiological mechanisms in the rat. Trends Neurosci 11: 163-169. - PubMed
    1. Bischof WF, Boulanger P (2003) Spatial navigation in virtual reality environments: an EEG analysis. Cyberpsychol Behav 6: 487-495. - PubMed
    1. Blair HT, Cho J, Sharp PE (1999) The anterior thalamic head-direction signal is abolished by bilateral but not unilateral lesions of the lateral mammillary nucleus. J Neurosci 19: 6673-6683. - PMC - PubMed
    1. Bland BH, Colom LV (1993) Extrinsic properties underlying oscillation and synchrony in the limbic cortex. Prog Neurobiol 2: 152-208. - PubMed
    1. Bland BH, Oddie SD (2001) Theta band oscillation and synchrony in the hippocampal formation and associated structures: the case for its role in sensorimotor integration. Behav Brain Res 127: 119-136. - PubMed

Publication types