. 2004 Sep 22;24(38):8322-32.
doi: 10.1523/JNEUROSCI.1536-04.2004.

Alcohol tolerance in large-conductance, calcium-activated potassium channels of CNS terminals is intrinsic and includes two components: decreased ethanol potentiation and decreased channel density

Affiliations

Alcohol tolerance in large-conductance, calcium-activated potassium channels of CNS terminals is intrinsic and includes two components: decreased ethanol potentiation and decreased channel density

Andrzej Z Pietrzykowski et al. J Neurosci. .

Abstract

Tolerance is an important element of drug addiction and provides a model for understanding neuronal plasticity. The hypothalamic-neurohypophysial system (HNS) is an established preparation in which to study the actions of alcohol. Acute application of alcohol to the rat neurohypophysis potentiates large-conductance calcium-sensitive potassium channels (BK), contributing to inhibition of hormone secretion. A cultured HNS explant from adult rat was used to explore the molecular mechanisms of BK tolerance after prolonged alcohol exposure. Ethanol tolerance was intrinsic to the HNS and consisted of: (1) decreased BK potentiation by ethanol, complete within 12 min of exposure, and (2) decreased current density, which was not complete until 24 hr after exposure, indicating that the two components of tolerance represent distinct processes. Single-channel properties were not affected by chronic exposure, suggesting that decreased current density resulted from downregulation of functional channels in the membrane. Indeed, we observed decreased immunolabeling against the BK alpha-subunit on the surface of tolerant terminals. Analysis using confocal microscopy revealed a reduction of BK channel clustering, likely associated with the internalization of the channel.


Figures
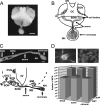
Figure 1.
Figure 1.
HNS explant contains viable AVP and OXT neurons of the intact SON–NH. A, Bright-field top view of an HNS explant. B, Diagram of HNS explant showing position of magnocellular neuron compartments: cell bodies, axons, and terminals. C, Immunofluorescent image (above) and sagittal diagram (below) of the SON–NH tract (AVP-positive, similar OXT-positive results not shown) indicate that axonal projections from SON magnocellular neurons to the neurohypophysis were preserved, and the SON–NH tract is the only structure present in the HNS explant. Note the winding path of axons from the SON, above the optic tract, below the sole of the third ventricle, through the median eminence to the neurohypophysis. D, Magnocellular neurons in SON were counted to estimate the viability of the HNS explants. Representative immunofluorescent grayscale images (top) of AVP neuron in the SON from explants cultured in 20 mm ethanol for 24 hr (similar data for OXT and fresh and naive explants not shown). Note the large cell body with long processes filled with hormone (left image) and large, nonapoptotic nucleus with diffuse Hoechst staining (right image, arrow).Other neurons are not visible because of the irout-of-focus location. The exact number of neurons in SON was estimated using stereological techniques (see Material and Methods) and is shown in the graph (bottom). Cap on each bar represents SD. ME, Median eminence; MM, medial mammilliary nucleus; PVN, paraventricular nucleus; 3V, third ventricle. Scale bars: A, 1.5 mm; C, 430 μm; D, 20 μm.
Figure 2.
Figure 2.
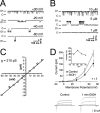
Voltage and calcium dependence of BK channels in naive NH terminals. A, Representative currents from a single BK channel, recorded in an inside-out patch at different potentials in the presence of 10μm free [Ca2+]i. Channel activity increases as the patch membrane is held at more depolarized potentials. B, Activity of a single BK channel as in A recorded at +30 mV in the presence of various [Ca2+]i. The activity increases as the cytosolic face of the channel is exposed to increasing concentrations of calcium. C and O1, adjacent to the traces, indicate the closed and the open states, respectively. C, Unitary conductance was determined by fitting the I–V relationship by linear regression.D, Ethanol-mediated potentiation of BK current is voltage-independent. Graph shows the average BK current amplitude (n = 5) as a function of the membrane voltage measured in whole-cell voltage clamp. Each terminal served as its own control. A 50 mm concentration of ethanol increased BK current amplitude at all the potentials tested between –10 and +70 mV in a voltage-independent manner (inset). Representative traces show BK currents recorded from a naive terminal and evoked at different membrane potentials (20 mV steps) before (control) and after 50 mm ethanol application. The fast transient current at the beginning of the voltage pulse is caused by sodium channels (TTX was omitted from the bath solution).
Figure 3.
Figure 3.
BK channels exhibit intrinsic tolerance to ethanol after 24 hr. A, Effects of acute ethanol in freshly isolated, naive, and chronic explants. Inside-out terminal patches were exposed to 5 μm free-Ca2+ control solution, and the potential across the membrane was set to produce low open probability (NPo around 0.2), to allow observation of ethanol (100 mm) potentiation. Whereas potentiation is evident in freshly isolated and naive terminals, chronic terminals show lack of ethanol effect on BK activity as shown in representative traces at the left of each panel. All-points amplitude histograms summarizing these effects are shown on the right.The washout histogram is omitted from the graph for clarity. Differences in unitary current amplitude reflect different holding potentials that were –50, –50, and –30 mV for patches from fresh, naive, and chronic conditions, respectively. B, The increase of BK channel open probability by acute ethanol challenge in naive (n = 7) and chronic (n = 12) explants. BK channel activity is expressed as the ratio of BK channel open probability after acute ethanol challenge over its activity before drug application (NPo EtOH /NPo Control), where 1 = no potentiation. Chronic ethanol treatment decreases BK channel potentiation by ethanol (p < 0.05) compared with the naive group. C, BK currents in terminals were recorded in whole-cell patch clamp to determine current densities. Membrane potential was held at –70 mV and depolarized for 500 msec from –50 to +90 mV in 20 mV increments. D, Average current densities (±SEM) recorded in naive (n = 5) and chronic (n = 4) terminals were significantly smaller (∼5-fold) after chronic ethanol exposure. Current densities are expressed as picoamperes per 10 μm2 (membrane capacitance was used to assess membrane area).
Figure 4.
Figure 4.
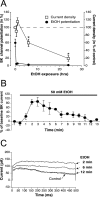
Time course of the development of ethanol tolerance of BK channels. A, HNS explants were cultured on Millipore inserts and exposed to ethanol for 0, 0.5, 1, 6, and 24 hr (n = 4–10). Ethanol tolerance of BK channels in the cultured NH terminals is manifested as both decreased sensitivity to ethanol, evident within 30 min of drug exposure and sustained for the entire 24 hr observation period, and reduced BK current density, evident after 6 hr, and continuing to decrease during the 24 hr observation period. B, The time course of decreased potentiation of BK current during the first few minutes was determined using the perforated patch-clamp technique with an isolated terminal from an ethanol-naive neurohypophysis (n= 2). The graph demonstrates the rapid loss of potentiation in the continued presence of ethanol. C, Representative traces of BK current from specified time points in B.
Figure 5.
Figure 5.
Chronic ethanol does not alter BK channel characteristics. A, Normalized NPo as a function of voltage at three different [Ca2+]i in naive (open symbols) and chronic (filled symbols) BK channels were fitted with a Boltzmann relationship of the type: Po = (1 + exp – K(VV0.5)) –1, where K is the logarithmic potential sensitivity, and V0.5 the potential at which Po is half-maximal. At each calcium concentration, naive and chronic BK channels are very similar. The PoV curve is shifted similarly along the voltage axis to more negative potentials as [Ca2+]i is increased. B, Data plotted in a manner that illustrates the lack of effect of chronic treatment on BK channel voltage sensitivity. The reciprocal of the slope of the ln(Po)–V relationship at low Po in the presence of 10μm free-Ca2+ indicated that the voltage necessary to produce an e-fold change in open probability was similar in naive (28 ± 1.22 mV) and chronic terminals (29 ± 1.21 mV). C, V0.5 values, obtained from Boltzmann fits displayed in A (dashed line), are now plotted as a function of [Ca2+]i on a logarithmic scale. Data points are fitted by a linear regression (r = 0.99). The leftward shift inV0.5 as [Ca2+]i increases is very similar in naive and chronic BK channels. D, The averaged mean open time of BK channels from naive (n = 6) and chronic explants (n = 7) are not different. Mean open time was calculated based on the equation: To = NPoT/Xo for multiple channel recordings [N, Number of channels; Po, open probability; T, time of observation (in milliseconds), Xo, number of openings]. E, The mean BK channel conductance from naive (n = 12) and chronic (n = 11) terminals obtained by fitting I–V plots (Fig. 2C) are not different.
Figure 6.
Figure 6.
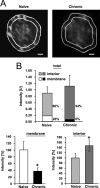
Chronic ethanol changes distribution of BK channels in neuronal terminals. A, Representative immunofluorescent confocal images (in a grayscale) of naive and chronic HNS terminals stained for BK pore-forming α subunit. Neurohypophysial terminals were homogenized and dropped onto a poly-l-lysine-coated Petri dish, fixed in paraformaldehyde, and double-labeled against AVP–OXT and BK channel α subunit. Laser-scanning fluorescence and DIC images were acquired simultaneously using a Leica laser-scanning microscope. Boundaries of the terminals were determined using DIC image, and each section of the terminal was divided into a membrane and an interior regions based on a membrane-associated fluorescence signal width of 0.45 μm (Chiu et al., 2002). Scale bar, 700 nm. B, Quantitative analysis in naive (n = 12) and chronic (n = 14) terminals showed that total BK expression in NH terminals is not significantly changed after chronic ethanol treatment (total). In contrast, membrane-associated BK expression decreases (membrane), whereas the amount of BK expressed in the interior increases (interior) after chronic ethanol treatment. *p < 0.05.
Figure 7.
Figure 7.
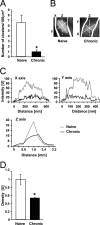
Chronic ethanol causes declustering of BK channels and reduces density of BK channels in clusters. Confocal images from naive and chronic terminals were used in this study. The number of BK clusters, their size, and the intensity profiles were determined using Leica quantification software (version 2.00; Microsystems). A, Quantification of the number of clusters in naive (n = 12) and chronic (n = 14) terminals shows a significant decrease after chronic ethanol treatment. B, Representative images of a naive and a chronic cluster showing axes used to determine three-dimensional density of BK in clusters. C, Intensity profiles of BK clusters in naive and chronic terminals measured along X, Y, and Z axes as shown in B. D, Quantification of BK density in naive (n = 40) and chronic (n = 8) clusters indicates that chronic ethanol causes an approximately twofold decrease in the BK density per cluster. (*p < 0.05).
Figure 8.
Figure 8.
Summary of modulation of BK channel function and distribution in neuronal terminals by chronic ethanol. After 24 hr exposure, BK channels are (1) less potentiated by acute challenge, (2) more internalized, (3) less clustered in the membrane, and (4) less dense within remaining clusters.

Similar articles

Cited by

References

    1. Armstrong WE (1995) Morphological and electrophysiological classification of hypothalamic supraoptic neurons. Prog Neurobiol 47: 291–339. - PubMed
    1. Ben Barak Y, Russell JT, Whitnall MH, Ozato K, Gainer H (1985) Neurophysin in the hypothalamo-neurohypophysial system. I. Production and characterization of monoclonal antibodies. J Neurosci 5: 81–97. - PMC - PubMed
    1. Bonde C, Noraberg J, Zimmer J (2002) Nuclear shrinkage and other markers of neuronal cell death after oxygen-glucose deprivation in rat hippocampal slice cultures. Neurosci Lett 327: 49–52. - PubMed
    1. Brewer GJ (1997) Isolation and culture of adult rat hippocampal neurons. J Neurosci Methods 71: 143–155. - PubMed
    1. Burbach JP, Luckman SM, Murphy D, Gainer H (2001) Gene regulation in the magnocellular hypothalamo-neurohypophysial system. Physiol Rev 81: 1197–1267. - PubMed

Publication types

MeSH terms

Substances

LinkOut - more resources