. 2004 Sep 22;24(38):8366-78.
doi: 10.1523/JNEUROSCI.1063-04.2004.

Evidence that each S cone in macaque fovea drives one narrow-field and several wide-field blue-yellow ganglion cells

Affiliations

Evidence that each S cone in macaque fovea drives one narrow-field and several wide-field blue-yellow ganglion cells

Stan Schein et al. J Neurosci. .

Abstract

A rule of retinal wiring is that many receptors converge onto fewer bipolar cells and still fewer ganglion cells. However, for each S cone in macaque fovea, there are two S-cone ON bipolar cells and two blue-yellow (BY) ganglion cells. To understand this apparent rule reversal, we reconstructed synaptic patterns of divergence and convergence and determined the basic three-tiered unit of connectivity that repeats across the retina. Each foveal S cone diverges to four S-cone ON bipolar cells but contacts them unequally, providing 1-16 ribbon synapses per cell. Next, each bipolar cell diverges to two BY ganglion cells and also contacts them unequally, providing approximately 14 and approximately 28 ribbon synapses per cell. Overall, each S cone diverges to approximately six BY ganglion cells, dominating one and contributing more modestly to the others. Conversely, of each pair of BY ganglion cells, one is dominated by a single S cone and one is diffusely driven by several. This repeating circuit extracts blue/yellow information on two different spatiotemporal scales and thus parallels the circuits for achromatic, spatial vision, in which each cone dominates one narrow-field ganglion cell (midget) and contributes some input to several wider-field ganglion cells (parasol). Finally, because BY ganglion cells have coextensive +S and -(L+M) receptive fields, and each S cone contributes different weights to different BY ganglion cells, the coextensive receptive fields must be already present in the synaptic terminal of the S cone. The S-cone terminal thus constitutes the first critical locus for BY color vision.


Figures
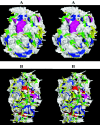
Figure 1.
Figure 1.
Foveal S-coneterminals express more than 20 active zones and contact more than 30 S-cone ON bipolar cell dendrites provided by four or five bipolar cells. In these stereo reconstructions of the synaptic surfaces of two foveal S cones, each cluster of yellow spheres indicate the site where a synaptic ribbon anchored to the presynaptic membrane. Thus, each cluster marks an active zone (numbered) where synaptic vesicles were released. Each active zone was presynaptic to a triad of postsynaptic processes, but the regions occupied by horizontal cell spines were excised (see Materials and Methods). Here, we show only the central processes (i.e., the ON bipolar cell dendrites) as colored patches. A, Terminal 35 contained 24 active zones that were presynaptic to 31 central elements from four different S-cone ON bipolar cells. Each color codes for a different bipolar cell, with each bipolar cell providing the number of central elements indicated in Figure 2 (see also Herr et al., 2003, their Table 2A). B, Terminal 52 (modified from Herr et al., 2003, their Fig. 9B) contained 25 active zones that were presynaptic to 43 central elements from five different S-cone ON bipolar cells, with numbers provided in Figure 2. Of five (orange) triad-associated contacts, 1, 2, 1, and 1 are provided by the bipolar cells colored green, blue, yellow, and cyan, respectively; two of these contacts are visible in this view.
Figure 5.
Figure 5.
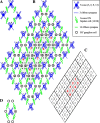
A standard pattern is generated by a model that uses densities of each cell type and typical patterns of divergence and convergence to capture the unit of connectivity across the three-tiered mosaic, a tile that repeats across the retina to generate the complete connectivity. A, Each S cone diverges to four S-cone ON bipolar cells, distributing its ∼30 ribbon synapses in the ratio 3:6:9:12, represented by 1, 2, 3, and 4 blue bonds. Two S cones converge on each bipolar cell. The S-cone bonds, in four configurations (a–d), are arranged so that single blue bonds are opposite quadruple blue bonds, and double blue bonds are opposite triple blue bonds, permitting each S-cone ON bipolar cell to collect five blue bonds, representing 15 ribbon synapses. Each S-cone ON bipolar cell diverges to two BY ganglion cells, distributing 14 ribbon synapses (single green bond) to one ganglion cell and 28 (double green bond) to the other. B, From the patterns of divergence and convergence at each level, plus the cell densities at each level (Fig. 3), we derive a unit of connectivity (large, gray diamond). It includes 16 ganglion cells in pairs within eight smaller diamonds. The standard pattern emerges: half of the ganglion cells are dominated by one S cone, half by more than one S cone, and each S cone dominates a single BY ganglion cell but contributes to several others. C, The large gray diamond in B, containing eight small diamonds (1–8), represents the unit of connectivity that repeats in larger arrays. A complete set thus includes the eight pairs of BY ganglion cells, the synaptic weights of which are shown in B, and eight S cones, one (the north one, for example) from each of the eight small diamonds. D, The model (B) establishes that each S cone diverges to six BY ganglion cells, dominating one of the six and contributing to the other five.
Figure 2.
Figure 2.
An S cone distributes its output to ∼30 bipolar cell dendrites but does so unequally, in numbers that are ∼12, 9, 6, and 3. Each S-cone terminal supplied numbers of ribbon synapses that are shown by the colored bars to different S-cone ON bipolar cells (Herr et al., 2003, their Table 2A). The coloring of the bars in the histograms for S-cone terminals 35 and 52 follows the coloring of the contacts made by each S-cone ON bipolar cell with those terminals in Figure 1. The numbers of synapses are arranged from largest to smallest, revealing a step-like pattern for each S cone. The mean of the total number of synapses is 33.3 central elements.
Figure 3.
Figure 3.
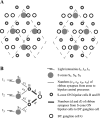
Relative cell densities (1:2:2) and calculation of synaptic weight. A, For each S cone, in the outermost layer of the retina, two S-cone ON bipolar cells are in the middle layer, and two BY ganglion cells are in the innermost layer. This stereo figure synthesizes data from Herr et al. (2003) and Calkins et al. (1998). Each dashed diamond houses one S cone, two S-cone ON bipolar cells, and two BY ganglion cells. The stereo view makes it easier to see the actual arrangement that is being represented by the symbols: S cones are in the outermost layer in the neural retina, the bipolar cells are in a middle layer, and the ganglion cells are in the innermost layer. To see the surfaces in depth, readers should cross their eyes. B, Because BY ganglion cells are linear, synaptic weights may be calculated as the product of the number of S-cone ribbon synapses onto S-cone ON bipolar cells and the number of bipolar ribbon synapses onto BY ganglion cells. The proof of this assertion is presented in Appendix.
Figure 4.
Figure 4.
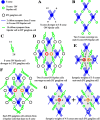
Circuit connecting an idealized S-cone array to BY ganglion cells. A, Each S-cone terminal makes ribbon synapses with four S-cone ON bipolar cells, which contribute 3, 6, 9, and 12 central elements. Each blue bond represents three ribbon synapses or central elements, so we can represent the numbers of central elements by a single blue bond, a double blue bond, a triple blue bond, and a quadruple blue bond. B, Each S-cone ON bipolar cell receives its input via a total of 15 central elements that it provides to two S-cone terminals, either 6 and 9 central elements (a double blue bond and a triple blue bond) or 3 and 12 central elements (a single blue bond and a quadruple blue bond). The real average total is 16.2 central elements (Herr et al., 2003). C, Each S-cone ON bipolar cell provides an output of 42 ribbon synapses to BY ganglion cells, one-third (or 14) to one ganglion cell and two-thirds (or 28) to a second. A green bond represents 14 ribbon synapses, so we represent 14 and 28 ribbon synapses by a single green bond and by a double green bond. D, Each idealized BY ganglion cell receives a total of 42 ribbon synapses, one-third (a single green bond) from one S-cone ON bipolar cell and two-thirds (a double green bond) from a second, and these two S-cone ON bipolar cells have an S cone in common. In this connectivity scheme, each ganglion cell is driven by three S cones. E, Three numbers are around each BY ganglion cell. Each number points from one S cone and represents the synaptic weight from that S cone, calculated as described in Results. The number 1 inside the (orange) ganglion cell on the right indicates that it is dominated by one S cone; correspondingly, the arrow in the east S cone points to the (orange) ganglion cell that it dominates. The number 3 inside the ganglion cell on the left indicates that it has three principal S cones. F, Each BY ganglion cell receives input from two S-cone ON bipolar cells, but these two bipolar cells have no S cone in common. In this scheme, each ganglion cell is driven by four S cones. G, The synaptic weights are calculated as in E. To have enough space to show the numbers representing synaptic weights, the figure is in two parts, one for each of the two ganglion cells in the diamond in F.
Figure 6.
Figure 6.
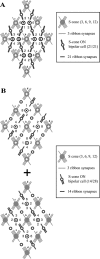
The standard pattern is independent of the partitioning of synapses between cones and bipolar cells and between bipolar cells and BY ganglion cells. A, Synaptic weights for an array of idealized S cones like that in Figure 5, except that S-cone ON bipolar cells and BY ganglion cells are connected by single green bonds, each representing 21 ribbon synapses. Four small diamonds, with four pairs of ganglion cells and four S cones, represent a unit of connectivity, a complete combinatorial set that repeats in larger arrays. Half of the eight BY ganglion cells are dominated by one S cone, and every one of the four S cones in the complete set dominates one BY ganglion cell. B, Synaptic weights for an array of idealized S cones like that in Figure 5, except that the two S-cone ON bipolar cells that activate each BY ganglion cell have no S cone in common, as in Figure 4, F and G, and each ganglion cell is driven by four S cones. One of the two ganglion cells in each small diamond is shown in the array at the top; the other of the two is shown in the array at the bottom. Four small diamonds, with four pairs of ganglion cells and four S cones, represent a complete combinatorial set that repeats in larger arrays. Half of the eight BY ganglion cells are dominated by one S cone, and every one of the four S cones in the complete set dominates one BY ganglion cell.
Figure 7.
Figure 7.
Reconstructed connections of S cones and S-cone ON bipolar cells generate the standard pattern. A, Each of the four real S cones is shown in just one (a, b, c, or d) configuration, and actual numbers of central elements are shown for each S cone. The position of each S cone in this arrangement is closest to the actual position of these S cones in their patch of foveal retina (Herr et al., 2003). B, An S-cone ON bipolar cell and a BY ganglion cell are connected by a single green bond or a double green bond, representing 14 or 28 ribbon synapses, respectively. Synaptic weights are the product of the actual number of central elements, not the number of blue bonds, and the number of green bonds. Eight diamonds, with eight pairs of ganglion cells and eight S cones, represent a unit of connectivity (i.e., a complete combinatorial set that repeats in larger arrays). C, An S-cone ON bipolar cell and a BY ganglion cell are connected by a single green bond, representing 21 ribbon synapses. Synaptic weights are the product of the actual number of central elements and the number of green bonds. Four diamonds, with four pairs of ganglion cells and four S cones, represent a unit of connectivity that repeats in larger arrays.
Figure 8.
Figure 8.
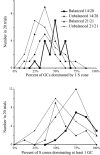
Random numbers of synapses between S cone and bipolar cells also generate the standard pattern or close to it. A, Frequency distributions for 20 trials of the percentage of 16 BY ganglion cells dominated by one S cone. Each trial uses an array with a set of four “random S cones,” with each random S cone presynaptic to four numbers of central elements randomly chosen among integers from 1 to 16. Distributions are shown for four different sets of constraints that are described in Results. B, Frequency distributions for the same 20 trials and constraints of the percentage of eight S cones that dominate at least one BY ganglion cell.
Figure 9.
Figure 9.
Synaptic weight ratios do not cluster. A, Synaptic weight ratios for 16 ganglion cells in the array in Figure 7B with four real S cones, balanced input to bipolar cells, and a 14/28 distribution of outputs from bipolar cells to ganglion cells. If S1/S2 ≥ 2, the ganglion cell is dominated by one S cone. If S1/S2 < 2 but S2/S3 ≥ 2, the ganglion cell has two principal S cones; otherwise, it has three. B, Synaptic weight ratios for 320 ganglion cells in 20 random arrays with the same constraints as in A.

Similar articles

Cited by

References

    1. Ahmad KM, Klug K, Herr S, Sterling P, Schein S (2003) Cell density ratios in a foveal patch in macaque retina. Vis Neurosci 20: 189–209. - PubMed
    1. Ahnelt P, Kolb H (1994a) Horizontal cells and cone photoreceptors in primate retina: a Golgi-light microscopic study of spectral connectivity. J Comp Neurol 343: 387–405. - PubMed
    1. Ahnelt P, Kolb H (1994b) Horizontal cells and cone photoreceptors in human retina: a Golgi-electron microscopic study of spectral connectivity. J Comp Neurol 343: 406–427. - PubMed
    1. Bumsted K, Hendrickson A (1999) Distribution and development of short-wavelength cones differ between Macaca monkey and human fovea. J Comp Neurol 403: 502–516. - PubMed
    1. Burris C, Klug K, Ngo IT, Sterling P, Schein S (2002) How Müller glial cells in macaque fovea coat and isolate the synaptic terminals of cone photo-receptors. J Comp Neurol 453: 100–111. - PubMed

Publication types

LinkOut - more resources