. 2004 Dec;15(12):5603-15.
doi: 10.1091/mbc.e04-05-0440. Epub 2004 Sep 22.

Bipolarization and poleward flux correlate during Xenopus extract spindle assembly

Affiliations

Bipolarization and poleward flux correlate during Xenopus extract spindle assembly

T J Mitchison et al. Mol Biol Cell. 2004 Dec.

Abstract

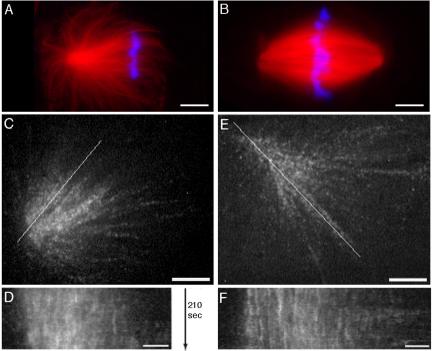
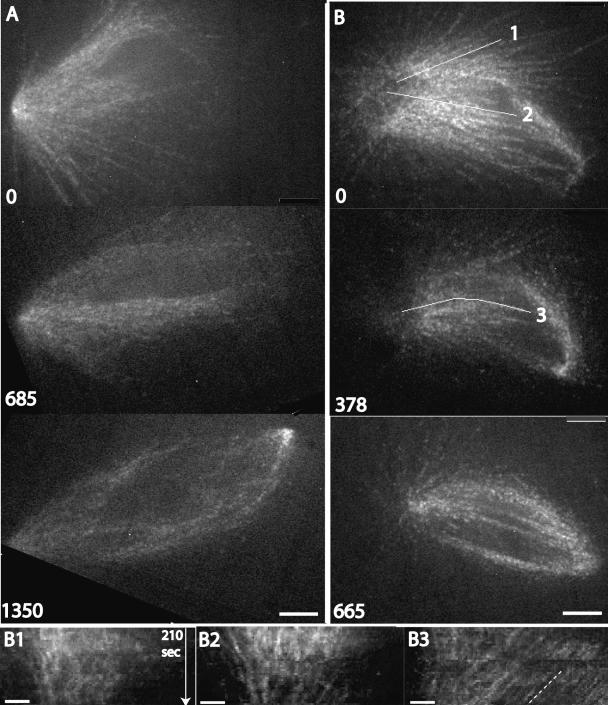
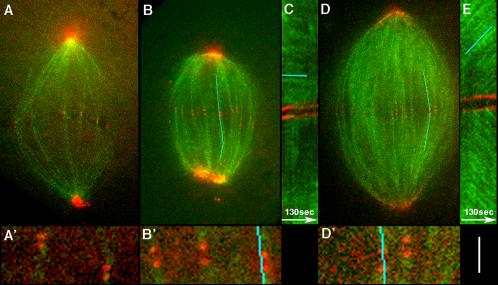
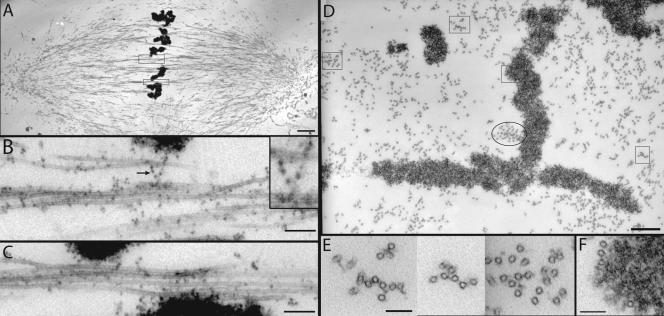
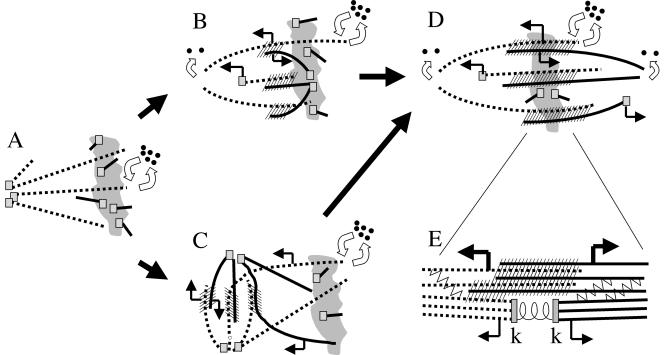
We investigated the mechanism by which meiotic spindles become bipolar and the correlation between bipolarity and poleward flux, using Xenopus egg extracts. By speckle microscopy and computational alignment, we find that monopolar sperm asters do not show evidence for flux, partially contradicting previous work. We account for the discrepancy by describing spontaneous bipolarization of sperm asters that was missed previously. During spontaneous bipolarization, onset of flux correlated with onset of bipolarity, implying that antiparallel microtubule organization may be required for flux. Using a probe for TPX2 in addition to tubulin, we describe two pathways that lead to spontaneous bipolarization, new pole assembly near chromatin, and pole splitting. By inhibiting the Ran pathway with excess importin-alpha, we establish a role for chromatin-derived, antiparallel overlap bundles in generating the sliding force for flux, and we examine these bundles by electron microscopy. Our results highlight the importance of two processes, chromatin-initiated microtubule nucleation, and sliding forces generated between antiparallel microtubules, in self-organization of spindle bipolarity and poleward flux.


Figures

Figure 1.
Figure 1.
CSF monopoles do not show evidence of flux by tubulin speckle microscopy. (A and B) Examples of fixed CSF monopoles and bipoles for reference. (C and E) Examples of CSF monopoles labeled with rhodamine tubulin at speckle levels that were followed by confocal microscopy, aligned, and kymographed. Two examples are shown from the 12 examples out of 20 sequences collected where the structure remained monopolar throughout the sequence. (A) Example of a typical CSF monopoles imaged by fixation 25 min after addition of sperm to CSF extract. Red signal is rhodamine tubulin, and blue is DNA. Note the asymmetric distribution of microtubules toward chromatin. Bar, 10 μm. (B) Example of a typical bipolar spindles formed by further incubation of the reaction shown in A. Fixation at 70 min after addition of sperm nuclei. Note that chromatin-pole distance is similar in bipoles and CSF monopoles. Bar, 10 μm. (C) Example of a CSF monopole by confocal imaging of tubulin at speckle levels. The chromatin is toward the right. The line was used to generate the kymograph in D. Bar, 5 μm. See Supplementary Video M1_1 (before alignment) and M1_2 (after alignment). (D) Kymograph of the monopole in C. Note the mostly vertical streaks, indicating no sliding of microtubules within the structure. Bar, 2 μm. (E) Another example of a CSF monopole by speckle imaging of tubulin. The line was used to generate the kymograph in F. Bar, 5 μm. See Supplementary Video M1_3 (after alignment). (F) Kymograph of the monopole in E. Bar, 2 μm.
Figure 2.
Figure 2.
Spontaneous bipolarization of CSF monopoles, and initiation of flux. CSF monopoles labeled with rhodamine tubulin at speckle levels were followed by confocal microscopy, followed by image alignment to correct for movement of the structure. Two examples are shown from the 8 examples out of 20 sequences collected where bipolarization occurred in a flow chamber. (A) Example where the spindle structure was tracked during its evolution from a monopole to a symmetrical bipole. The speckle contrast is too low for kymography, but in the supplementary video evidence for bidirectional microtubule sliding can be seen after bipolarization. Elapsed time shown in seconds. Bar, 5 μm. See Supplementary Video M2_1. (B) Example with better speckle contrast. The first pole is to the left. At the first time point the structure already showed evidence of new pole formation to the right, but was still mainly monopolar. Later the structure evolved into a symmetrical bipole. The lines show where kymographs were collected. In the supplementary video, the structure shows little or no microtubule sliding early and robust bidirectional sliding late. Elapsed time shown in seconds. Bar, 5 μm. See Supplementary Video M2_2. (B1 and B2) Kymographs early in the sequence shown in B, starting at t = 0, along the lines indicated as 1 and 2. Bar, 2 μm. Early in the sequence (toward the top of kymograph) individual tubulin speckles are either static (vertical streaks) or moving slowly in an incoherent manner. There is some movement of speckles near the pole into the structure, which we think indicates the pole becoming more focused. (B3) Kymograph later in the sequence shown in B, starting at t = 378 s, along the line indicated as 3. By this time the structure showed coherent movement of speckles toward the old (left) pole in the supplementary video. Note the parallel, diagonal streaks in the kymograph, indicative of coherent microtubule sliding. The line is drawn parallel to these steaks to highlight them. Time axis as B1. Bar, 2 μm
Figure 3.
Figure 3.
Labeled anti-TPX2 as a probe for spindle poles and flux. Cycled bipolar spindles were labeled with Alexa 488 anti-TPX2 (top panels in each pair) and rhodamine tubulin at speckle levels (bottom panels in each pair). All kymographs were taken on a line through both poles, with the time and scale bar shown in D. (A) Example of a bipolar spindle. The anti-TPX2 probe accumulates at the poles (p). It also labels puncta and fibrils throughout the spindle, which are partly coaligned with tubulin (e.g., arrows). Faint accumulation of the probe on chromatin can also been seen in this example (ch)aa. Bar, 5 μm. See Supplementary Video M3_1. (B) Kymograph of the spindle shown in A. Top panel, anti-TPX2; bottom panel, tubulin. Anti-TPX2 puncta and tubulin speckles move continuously toward the poles at the same rate, indicated by the diagonal steaks. This is diagnostic of poleward flux. Time and scale bar for B–D shown in D. See Supplementary Video M3_1. (C) Kymograph of a spindle treated with 2 mM AMPPNP. This treatment blocks poleward flux (Sawin and Mitchison, 1991b). Note that both anti-TPX2 puncta and tubulin speckles are static, indicated by vertical lines. In the supplementary video, the anti-TPX2 signal is much more tightly coaligned with tubulin in AMPPNP compared with control. See Supplementary Video M3_2. (D) Kymograph of a spindle assembled in the presence of p50 dynamitin (0.9 mg/ml), a dynactin antagonist that blocks pole assembly but not flux. Note poleward movement of anti-TPX2 puncta and tubulin speckles at the same rate. Note also that anti-TPX2 does not accumulate at the unfocussed poles. The rate of flux is slower in this example than B, but this was not always the case for p50 spindles. We are currently developing better tools to measure flux rate and explore its variability. See Supplementary Video M3_3.
Figure 4.
Figure 4.
Pathways for spontaneous bipolarization. CSF monopoles labeled with rhodamine tubulin at speckle levels (left panels in each pair) and Alexa 488 anti-TPX2 (right panels) were imaged by spinning disk confocal microscopy. The numbers are elapsed time in seconds. The position of chromatin at the beginning of each sequence is marked ch. The direction of microtubule sliding within each structure is marked with chevrons. Bars, 5 μm. (A) Example of new pole assembly near chromatin. A cloud of fibrils labeled with anti-TPX2 forms around chromatin, marked by the arrow at 280 s. This cloud partially condenses and begins to move upward, associated with microtubule sliding (top chevron at 580 s). At the same time the lower pole becomes more focused, and sliding toward this pole initiates (lower chevron). By 1000 s the structure has evolved into an almost symmetrical bipole. See Supplementary Video M4_1. (B) Example of pole splitting. The initially unfocussed pole starts to split around 250 s. By 525 s microtubule sliding is evident, tracking with the splitting poles. See Supplementary Video M4_2. (C) Example where both pathways occur. The pole starts to split around 240 s. By 550 s the poles are separating rapidly, associated with bidirectional microtubule sliding. Around this time, a new pole coalesces near chromatin (arrow). Apparently unidirectional sliding is also microtubule sliding evident around the chromatin, transporting microtubules toward the splitting poles. By 880 s the structure has evolved into a tripolar spindle. See Supplementary Video M4_3. (D) Tracking of pole separation from the sequences in B and C. X-axis is time in seconds; Y-axis is pole-pole distance in micrometers. Average and (peak) rates of separation were ∼1 (2) μm/min in B and ∼2 (2.5) μm/min in C.
Figure 5.
Figure 5.
Removal of overlap microtubules and inhibition of flux, by excess importin-alpha. (A) Example of a spindle after addition of importin-alpha (1 mg/ml) to cycled spindles, visualized by confocal microscopy. Green is X-rhodamine-tubulin at speckle levels; red is a mixture of Alexa 488–labeled, nonperturbing IgGs to CenpA and NUMA, to visualize both kinetochores and poles. Note that prominent microtubule bundles still connect sister kinetochores to the poles. The total microtubule density is greatly reduced compared with control spindles, and overlap bundles that are prominent in control spindles are missing. A′ is a 4× magnification of the kinetochore region. See Supplementary Video M5_1. (B) Another example of an importin-alpha–treated spindle. The blue line is the center of a 7-pixel-wide line that included the kinetochore pair throughout the sequence that was used to measure the kymograph in C. B′ is a 4× magnification of kinetochore region. See Supplementary Video M5_2. (C) Kymograph from the importin-alpha–treated spindle shown in B. Note the horizontal green streaks (highlighted by blue line), indicating lack of microtubule sliding relative to the kinetochores. (D) Control spindle containing the same probes as A and B. The line is the center of a 7-pixel-wide lines that was used to measure the kymograph in E. D′ is a 4× magnification of kinetochore region. See Supplementary Video M5_3. (E) Kymograph from the control spindle shown in D. Note the diagonal green streaks, indicating microtubule sliding away from kinetochores, characteristic of poleward flux. Bar, 10 μm (A, B, and D); 2.5 μm (A′, B′, and D′); 3.3 μm (C and E).
Figure 6.
Figure 6.
Electron microscopy of overlap bundles in bipolar spindles. Cycled spindles were diluted 100-fold into a microtubule-stabilizing buffer, fixed, sedimented, and sectioned as described (Ohi et al., 2003). (A) Longtitudinal section through the center of a spindle. The boxed regions, containing microtubule bundles that do not attach to kinetochores, are shown magnified in B and C. (B) Longtitudinal section through a nonkinetochore bundle at the equator. We know from speckle imaging that these bundles contain antiparallel microtubules (Maddox et al., 2003). Note the dark dots attached to microtubules, sometimes via amorphous material. These dots are probably ribosomes (see text). Arrow and inset show an example of a string of amorphous material containing ribosomes connecting two microtubules. (C) Another example of a nonkinetochore bundle. (D) Cross section near the equator of a different spindle. The square boxes are shown at higher magnification in E and F. The oval box marks a microtubule bundle that partly terminates in a kinetochore in adjacent sections. (E) Cross section through three nonkinetochore bundles from D. Again, mixed polarities must be present in these bundles. Note the presence of amorphous material bridging between microtubules. (F) Example of microtubules that make a lateral association with chromatin but are not part of a kinetochore fiber. Many such interactions are present. Bars (nm): A, 2000; B, 200, inset 100; C, 200; D, 500; E and F, 100.
Figure 7.
Figure 7.
Models for spontaneous bipolarization. The irregular gray shape is chromatin. Dotted and solid lines are microtubules of opposite polarities. Small squares are minus end nucleating/capping complexes. Curved open arrows represent polymerization dynamics, with all plus ends undergoing dynamic instability, and uncapped minus ends undergoing slow depolymerization or some other form of instability. Straight arrows denote microtubule sliding direction. Hash marks are antiparallel interactions that generate antiparallel sliding forces, presumably through recruitment of Eg5 (Miyamoto et al., unpublished results). (A) CSF Monopole. No sliding, minus ends at the pole are capped. Nucleation occurs near chromatin, to generate microtubules that are initially short and disorganized. (B) New pole assembly near chromatin. Nucleating complexes at chromatin aggregate into new pole, creating a zone of antiparallel overlap that recruits sliding motors. This tends to push the new pole outward, generating positive feedback that increases the zone of overlap, leading to bipolarization. Because the new pole moves out, minus ends at the pole must be capped. Sliding forces from the overlap zone also push microtubules toward the old pole. Because the old pole remains at approximately a constant distance from chromatin, minus ends must start depolymerizing at the old pole. How minus end dynamics are differentially regulated at the two poles is not clear. (C) Pole splitting pathway. The old pole splits, creating a zone of antiparallel overlap that recruits sliding motors. This tends to increase pole separation, generating positive feedback leading to bipolarization. Sliding apart of the poles causes microtubules near chromatin to slide toward the bipolarizing region. Minus ends must be capped at both poles during splitting, so sliding leads to pole separation rather than minus end depolymerization. (D) Steady state bipole. Nucleation continues near chromatin, and the resulting capped minus ends are moved poleward by microtubule sliding forces from overlap zones. Minus ends that reach the pole become uncapped and start to depolymerize, but note that the majority of depolymerization occurs by dynamic instability of plus ends. Nucleation, polymerization, sliding and depolymerization are balanced by unknown mechanisms to create a steady state in length and mass. (E) Hypothesis for flux in kinetochore microtubules. Anti-parallel sliding forces (heavy bent arrows) are generated in overlap bundles (hatched area), most likely by Eg5 activity. These forces are transmitted to kinetochore microtubules by cross-linking factors (zig-zag lines), and/or by kinetochore microtubules participating directly in force-generating overlap interactions (hatched area). Kinetochore microtubules respond by sliding poleward (thin bent arrows). Friction at the kinetochore resists sliding, generating poleward force that pulls sister kinetochores (k-k) apart.

References

    1. Brust-Mascher, I., and Scholey, J.M. (2002). Microtubule flux and sliding in mitotic spindles of Drosophila embryos. Mol. Biol. Cell 13, 3967-3975. - PMC - PubMed
    1. Chen, W., and Zhang, D. (2004). Kinetochore fibre dynamics outside the context of the spindle during anaphase. Nat. Cell Biol. 6, 227-231. - PubMed
    1. Desai, A., Murray, A., Mitchison, T.J., and Walczak, C.E. (1999a). The use of Xenopus egg extracts to study mitotic spindle assembly and function in vitro. Methods Cell Biol. 61, 385-412. - PubMed
    1. Field, C.M., Oegema, K., Zheng, Y., Mitchison, T.J., and Walczak, C.E. (1998). Purification of cytoskeletal proteins using peptide antibodies. Methods Enzymol. 298, 525-541. - PubMed
    1. Gorlich, D., Prehn, S., Laskey, R.A., and Hartmann, E. (1994). Isolation of a protein that is essential for the first step of nuclear protein import. Cell 79, 767-778. - PubMed

Publication types

MeSH terms