Review
. 2004 Sep-Oct;9(5):893-912.
doi: 10.1117/1.1779233.

From quantitative microscopy to automated image understanding

Affiliations
Review

From quantitative microscopy to automated image understanding

Kai Huang et al. J Biomed Opt. 2004 Sep-Oct.

Abstract

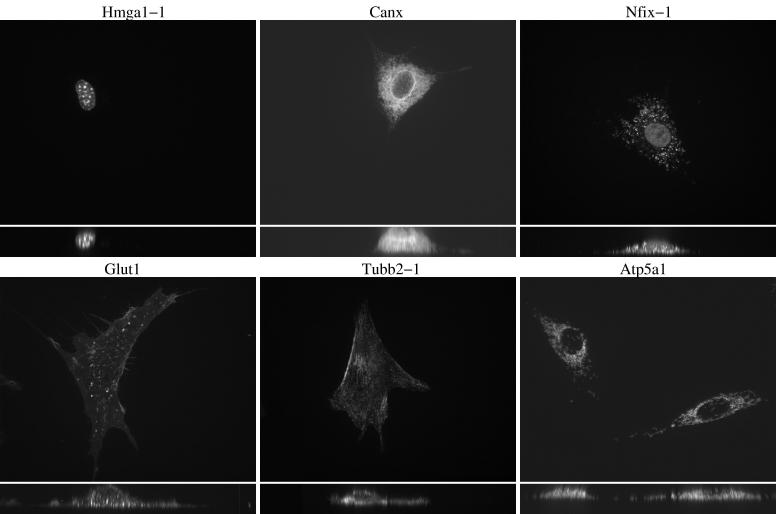
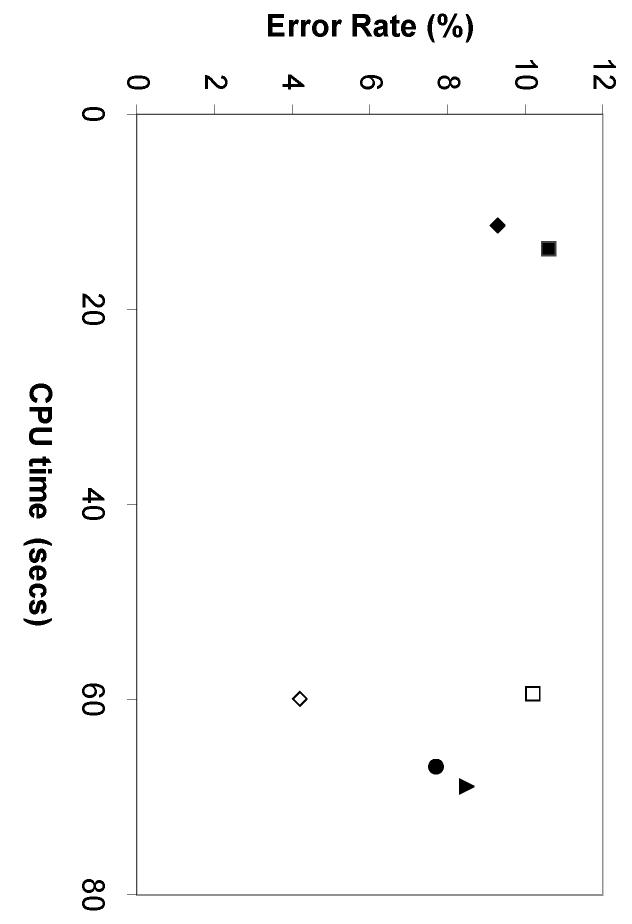
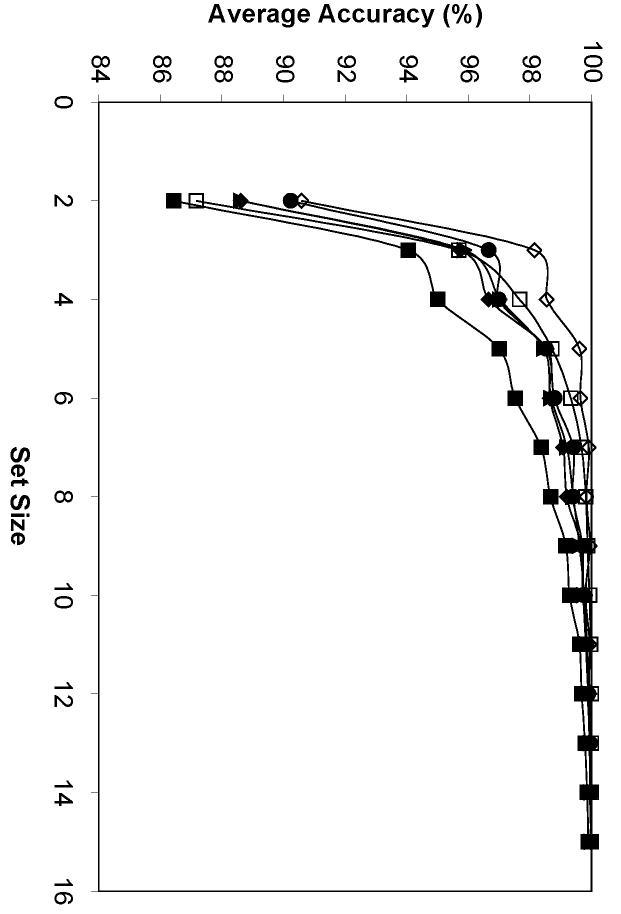
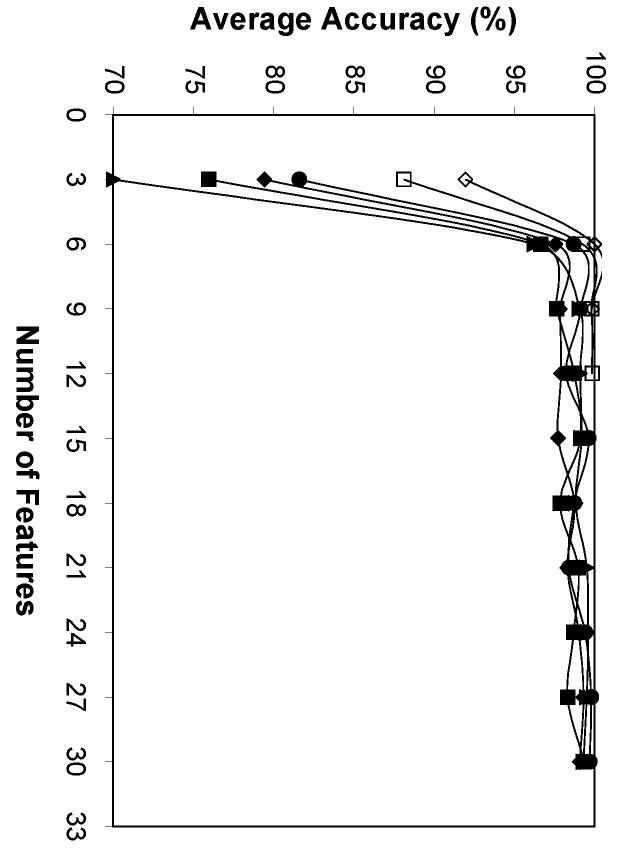
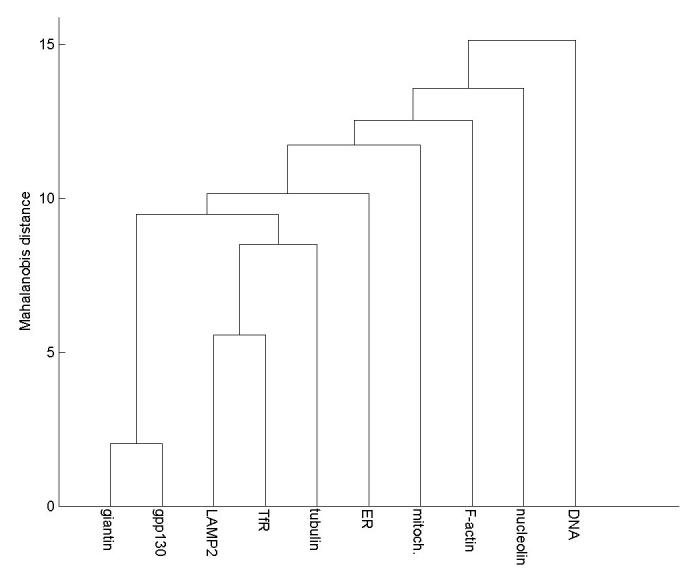
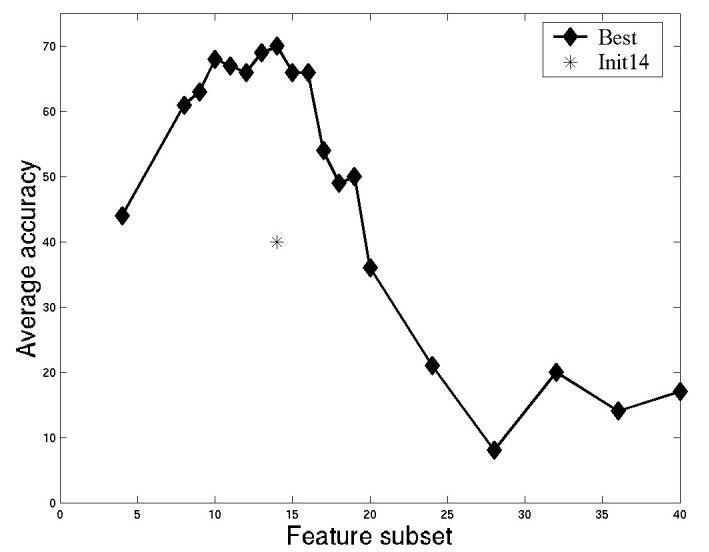
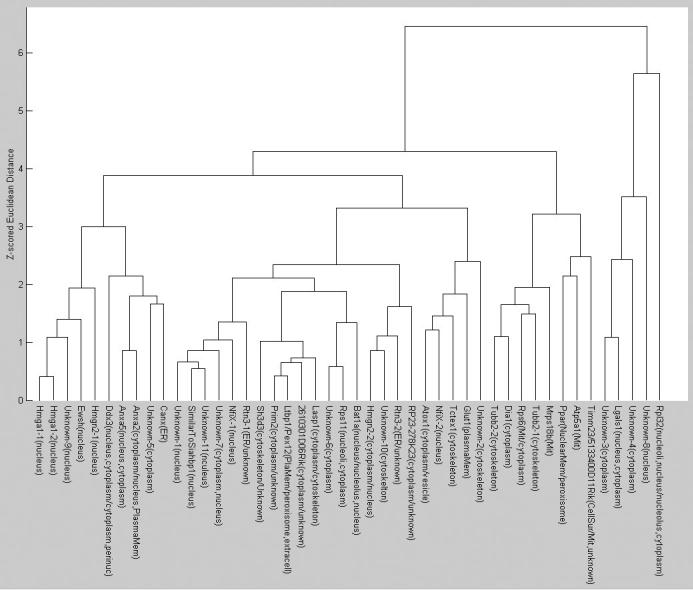
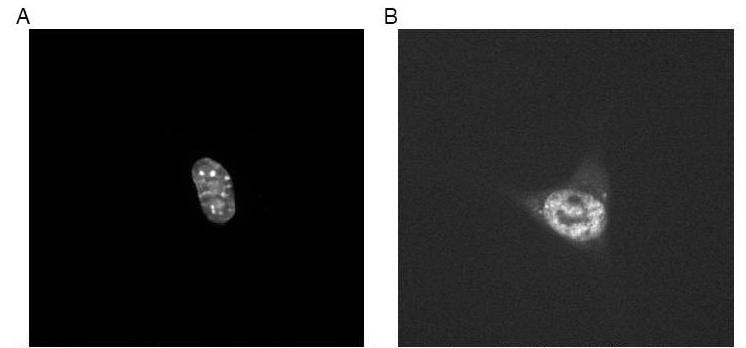
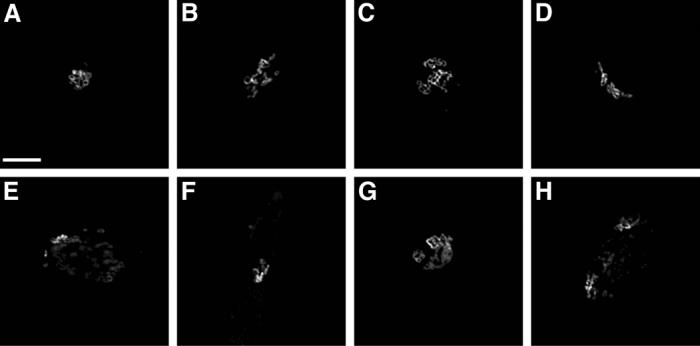
Quantitative microscopy has been extensively used in biomedical research and has provided significant insights into structure and dynamics at the cell and tissue level. The entire procedure of quantitative microscopy is comprised of specimen preparation, light absorption/reflection/emission from the specimen, microscope optical processing, optical/electrical conversion by a camera or detector, and computational processing of digitized images. Although many of the latest digital signal processing techniques have been successfully applied to compress, restore, and register digital microscope images, automated approaches for recognition and understanding of complex subcellular patterns in light microscope images have been far less widely used. We describe a systematic approach for interpreting protein subcellular distributions using various sets of subcellular location features (SLF), in combination with supervised classification and unsupervised clustering methods. These methods can handle complex patterns in digital microscope images, and the features can be applied for other purposes such as objectively choosing a representative image from a collection and performing statistical comparisons of image sets.


Figures

Figure 1
Figure 1
Feature selection using genetic algorithms. From [29].
Figure 2
Figure 2
Typical images from the 5-class 2D CHO cell image collection after preprocessing. Five major subcellular location patterns are: giantin(A), LAMP2(B), NOP4(C), tubulin(D), and DNA(E). From [23].
Figure 3
Figure 3
Typical images from the 10-class 2D HeLa cell image collection after preprocessing. Each image is displayed with two false colors: red (DNA) and green (target protein).
Figure 4
Figure 4
Typical images from the 11-class 3D HeLa cell image collection after preprocessing. Each 3D image is displayed with three false colors: red (DNA), blue (total protein), and green (target protein). The target proteins used are the same as those of Figure 2. Two projections on the X-Y and X-Z planes are shown together.
Figure 5
Figure 5
Selected images from the 3D 3T3 cell image collection after preprocessing. Each image represents a major cluster from the Subcellular Location Tree created by cluster analysis [5]. Projections on the X-Y and X-Z planes are shown together.
Figure 6
Figure 6
Best performance of six feature sets vs. their time costs on the 2D and 3D HeLa image collections. SLF8 (filled square), SLF10 (open diamond), SLF13 (filled diamond), SLF14 (open square), SLF15 (filled triangle), SLF16 (filled circle).
Figure 7
Figure 7
Average performance of six feature sets in image sets classification with different set sizes. SLF8 (filled square), SLF10 (open diamond), SLF13 (filled diamond), SLF14 (open square), SLF15 (filled triangle), SLF16 (filled circle).
Figure 8
Figure 8
Average performance of six feature sets using different numbers of features in classifying 10-image sets. SLF8 (filled square), SLF10 (open diamond), SLF13 (filled diamond), SLF14 (open square), SLF15 (filled triangle), SLF16 (filled circle).
Figure 9
Figure 9
A Subcellular Location Tree (SLT) created for the 10-class 2D HeLa cell collection. From [50].
Figure 10
Figure 10
Selecting the best feature subset from SLF11 to classify the 46-class 3D 3T3 cell image collection. The average performance of a neural network classifier with one hidden layer and twenty hidden nodes after 20 cross validation trials is shown for sets comprising increasing numbers of features from SDA. From [5].
Figure 11
Figure 11
A Subcellular Location Tree created by using the best 10 features selected from SLF11 by SDA for the 46 proteins from the 3T3 image collection. From [5].
Figure 12
Figure 12
Two example images selected from the two nuclear clusters shown in Figure 11. (A) Hmga1-1; (B) Unknown-11. From [5].
Figure 13
Figure 13
Most and least typical giantin images selected from a contaminated image set. (A-D): giantin images with high typicality; (E-H): giantin images with low typicality. From [52].

References

    1. Macbeath G. Protein microarrays and proteomics. Nature Genetics. 2002;32:526–532. - PubMed
    1. Cutler P. Protein arrays: The current state-of-the-art. Proteomics. 2003;3:3–18. - PubMed
    1. Sali A, Glaeser R, Earnest T, Baumeister W. From words to literature in structural proteomics. Nature. 2003;422:216–225. - PubMed
    1. Ghaemmaghami S, Huh WK, Bower K, Howson RW, Belle A, Dephoure N, O'Shea EK, Weissman JS. Global analysis of protein expression in yeast. Nature. 2003;425:737–41. - PubMed
    1. Chen X, Velliste M, Weinstein S, Jarvik JW, Murphy RF. Location proteomics - Building subcellular location trees from high resolution 3D fluorescence microscope images of randomly-tagged proteins. Proc. SPIE. 2003;4962:298–306.

Publication types

MeSH terms