. 2004 Oct;136(2):3333-40.
doi: 10.1104/pp.104.044131. Epub 2004 Sep 24.

Starch division and partitioning. A mechanism for granule propagation and maintenance in the picophytoplanktonic green alga Ostreococcus tauri

Affiliations

Starch division and partitioning. A mechanism for granule propagation and maintenance in the picophytoplanktonic green alga Ostreococcus tauri

Jean-Philippe Ral et al. Plant Physiol. 2004 Oct.

Abstract

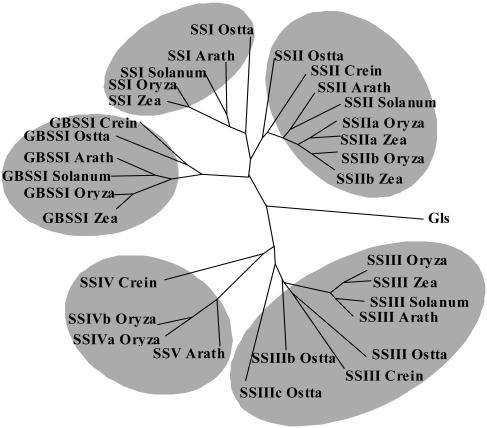
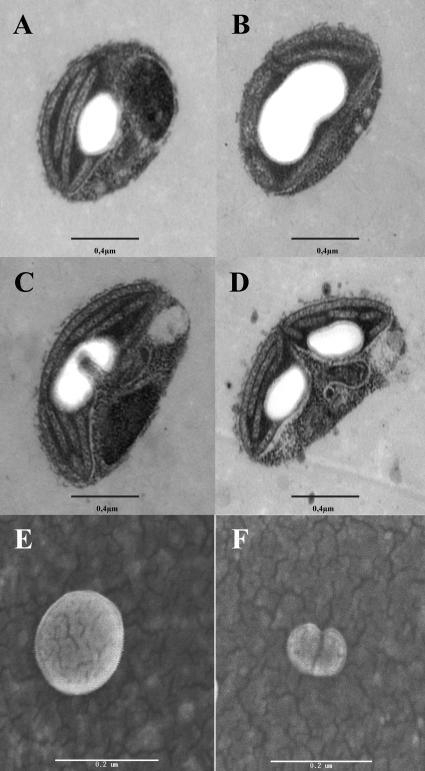
Whereas Glc is stored in small-sized hydrosoluble glycogen particles in archaea, eubacteria, fungi, and animal cells, photosynthetic eukaryotes have resorted to building starch, which is composed of several distinct polysaccharide fractions packed into a highly organized semicrystalline granule. In plants, both the initiation of polysaccharide synthesis and the nucleation mechanism leading to formation of new starch granules are currently not understood. Ostreococcus tauri, a unicellular green alga of the Prasinophyceae family, defines the tiniest eukaryote with one of the smallest genomes. We show that it accumulates a single starch granule at the chloroplast center by using the same pathway as higher plants. At the time of plastid division, we observe elongation of the starch and division into two daughter structures that are partitioned in each newly formed chloroplast. These observations suggest that in this system the information required to initiate crystalline polysaccharide growth of a new granule is contained within the preexisting polysaccharide structure and the design of the plastid division machinery.


Figures

Figure 1.
Figure 1.
Separation of amylose and amylopectin CL2B gel permeation chromatography of starch from O. tauri (1 mg) dispersed in 10 mm NaOH (A) in comparison with C. reinhardtii (2 mg; B) and Arabidopsis (1 mg; C). The λmax (wavelength of the maximal absorbance of the iodine-polysaccharide complex in nanometers) is scaled on the right axis. The absorbency of the complex at λmax measured for each fraction is indicated on the left axis. The low λmax fraction excluded from the column defines amylopectin, while the high λmax amylose is separated throughout the column. The x axis shows the elution volume in milliliters.
Figure 2.
Figure 2.
Polysaccharide CL distributions. Histograms of CL distributions obtained after isoamylase-mediated enzymatic debranching through capillary electrophoresis of 8-amino-1,3,6-pyrenetrisulfonic acid-labeled fluorescent glucans. The x axis displays degree of polymerization scales (DP 3–35) and the y axis represents the relative frequency of chains expressed as percentages. A, CL distribution of purified amylopectin from O. tauri. B and C, CL distribution of purified amylopectin from Arabidopsis (B) and C. reinhardtii (C) wild-type references. D, Bovine liver glycogen CL distribution.
Figure 3.
Figure 3.
Histograms of ADP-Glc pyrophosphorylase activity. A displays the assay in the nonphysiological direction of pyrophophorolysis in the presence (white box) or absence (black box) of 1 mm 3PGA. Units are expressed in nanomoles of Glc-1-P formed per minute and per milligram of protein. B represents the activity of ADP-Glc pyrophosphorylase in the direction of ADP-Glc synthesis in the presence or absence of 1 mm activator. Units are expressed in nanomoles of Glc-1-P degraded per minute and per milligram of protein.
Figure 4.
Figure 4.
Analysis of GBSSI activity and protein from O. tauri starch granules. A, Coomassie Brilliant Blue R-250 stained 7.5% SDS-acrylamide gels of starch-bound proteins. Lane 1 represents starch-bound proteins extracted from 2 mg of polysaccharides purified after nitrogen starvation. Lane 2 displays the molecular-mass marker with the corresponding masses expressed in kilodaltons. B, Kinetics of in vitro synthesis of amylose. Starch from O. tauri was subjected to in vitro synthesis in the presence of 14C-labeled ADP-Glc. After 16 h (black line) and 40 h (doted line) of in vitro synthesis, the amylopectin and amylose were separated by CL2B-sepharose chromatography. C, ADP-Glc kinetics of the GBSSI from O. tauri. A total of 100 μg of polysaccharides were incubated with different concentrations of ADP-Glc (▪) or UDP-Glc (○).
Figure 5.
Figure 5.
Dendogram of starch synthases in plants and algae and glycogen synthases from Synechocystis. Sequences were aligned with ClustalW (Thompson et al., 1994). The sequence alignment was manually improved using BioEdit (Hall, 1999) and ForCon (Van de Peer et al., 1998). TreeCon (Van de Peer and De Wachter, 1997a, 1997b) was used for constructing the neighbor-joining (Saitou and Nei, 1987) tree based on Poisson-corrected distances, only taking into account unambiguously aligned positions (600 amino acids). Bootstrap analysis with 500 replicates was performed to test the significance of the nodes. The amino acid sequences used were as follows: C. reinhardtii (Crein) GBSSI (AF26420), SSII (AAC17970), SSIII, SSIV (TO7926); maize (Zea) GBSSI (M24258), SSI (AF036891), SSIIa (Harn et al., 1998), SSIIb (Harn et al., 1998); rice (Oryza) GBSSI (X62134), SSI (D16202), SSIIa (AF419099), SSIIb (Harn et al., 1998), SSIII (Gao et al., 1998), SSIVa (AY1OO470), SSIVb (AY100471); Solanum tuberosum (Solanum) GBSSI (X58453), SSI (Y10416), SSII (X87988), SSIII (X94400); Arabidopsis (Arath) GBSSI (AC006424), SSI (AF121673), SSII (AC008261), SSIII (AC007296), SSV (A021713), and Synechocystis glycogen-synthase Gls (NP441947). Accession numbers for Ostreococcus sequences are given as supplemental material.
Figure 6.
Figure 6.
Micrographs of dividing starch granule in O. tauri. A to D, TEM of dividing O. tauri cells. Poorly synchronized cultures contain a mixture of cells at different stages of plastid division (bar = 0.4 μm). E and F, Field emission type SEM images of dividing starch granule purified from synchronized cultures. Starch granules isolated from G1 cells (E) and G2/M-phase (F). Cultures were synchronized by 12-h-day/12-h-night growth cycles. G1 granules always appear spherical with a somewhat smoother surface, while G2/M starch granules are small often compounded with a rough surface (bar = 0.2 μm).

References

    1. Alonso MD, Lomako J, Lomako WM, Whelan WJ (1995) A new look at the biogenesis of glycogen. FASEB J 12: 1126–1137 - PubMed
    1. Ball S, Marianne T, Dirick L, Fresnoy M, Delrue B, Decq AA (1991) Chlamydomonas reinhardtii low-starch mutant is defective for 3-phosphoglycerate activation and orthophosphate inhibition of ADP-glucose pyrophosphorylase. Planta 185: 17–26 - PubMed
    1. Ball SG, Morell MK (2003) From bacterial glycogen to starch: understanding the biogenesis of the plant starch granule. Annu Rev Plant Biol 54: 207–233 - PubMed
    1. Ballicora MA, Iglesias AA, Preiss J (2003) ADP-glucose pyrophosphorylase, a regulatory enzyme for bacterial glycogen synthesis. Microbiol Mol Biol Rev 67: 213–225 - PMC - PubMed
    1. Buléon A, Colonna P, Planchot V, Ball S (1998) Starch granules: structure and biosynthesis. Int J Biol Macromol 23: 85–112 - PubMed

Publication types

Associated data

LinkOut - more resources