. 2004 Oct 12;101(41):14689-94.
doi: 10.1073/pnas.0305199101. Epub 2004 Sep 24.

Local graph alignment and motif search in biological networks

Affiliations

Local graph alignment and motif search in biological networks

Johannes Berg et al. Proc Natl Acad Sci U S A. .

Abstract

Interaction networks are of central importance in postgenomic molecular biology, with increasing amounts of data becoming available by high-throughput methods. Examples are gene regulatory networks or protein interaction maps. The main challenge in the analysis of these data is to read off biological functions from the topology of the network. Topological motifs, i.e., patterns occurring repeatedly at different positions in the network, have recently been identified as basic modules of molecular information processing. In this article, we discuss motifs derived from families of mutually similar but not necessarily identical patterns. We establish a statistical model for the occurrence of such motifs, from which we derive a scoring function for their statistical significance. Based on this scoring function, we develop a search algorithm for topological motifs called graph alignment, a procedure with some analogies to sequence alignment. The algorithm is applied to the gene regulation network of Escherichia coli.


Figures

Fig. 1.
Fig. 1.
Motifs and alignment in topological networks. (a) A randomly chosen connected subgraph is likely to be a tree; i.e., it has the number of internal links equal to its number of nodes minus 1. (b) Putatively functional subgraphs are distinguished by internal loops, i.e., by a higher number of internal links. (c) An alignment of three subgraphs with four nodes each. Each node carries an index α = 1, 2, 3 labeling its subgraph and an index i = 1, 2, 3, 4 given by the order of nodes within the subgraph. Nodes with the same index i are joined by dashed lines, defining a one-to-one mapping between any two subgraphs. Network links are shown as solid lines (with their arrows suppressed for clarity). (d) The consensus pattern of this alignment. Each link occurs with a likelihood ij indicated by the gray scale.
Fig. 2.
Fig. 2.
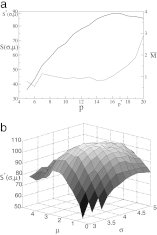
Maximum score alignment and parametric optimization. (a) Score optimization at fixed scoring parameters σ = 3.8 and μ = 4.0. The total score S (thick line) and the fuzziness (thin line) are shown for the highest-scoring alignment of p subgraphs, plotted as a function of p. (b) The score S*(σ, μ) plotted against the parameters μ and σ. The unique maximum S*defines the maximum-likelihood parameters σ* = 3.8 and μ* = 2.25.
Fig. 3.
Fig. 3.
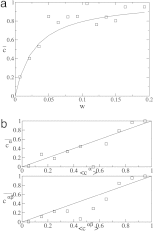
Statistics of motif ensembles. (a) Testing the statistical model for single subgraphs (Eq. 5). Nontreelike subgraphs are enumerated and node pairs i, j are binned according to wij. The fraction of such pairs carrying a link is shown against wij. The solid line results from fitting the model with enhanced number of links (Eq. 5) to these data, giving σ = 3.8. (b) Testing the statistical model for alignments (Eq. 8). (Upper) The average value of formula image over all α, i, j with a given expectation value of formula image according to Eq. 8 at σ = σ* = 3.8 and μ = μ* = 2.25 against the corresponding expectation value (□). For a perfect fit between model and data a straight line is expected (shown solid). (Lower) The same procedure is used averaging the two-point function formula image over all α, β, i, j with a given expectation value formula image.
Fig. 4.
Fig. 4.
Probabilistic motifs in the E. coli transcription network. (a) Consensus motifs with n = 4 nodes at different values of μ. From left to right, μ = μ* = 3.6, μ = 8, and μ = 15. The gray scale of the links indicates the likelihood that a given link is present in the aligned subgraphs; the five gray values correspond to in the ranges 0.1–0.2, 0.2–0.4, 0.4–0.6, 0.6–0.8, and 0.8–0.9, and links with > 0.9 are shown black. The link reward is kept fixed at σ = σ* = 3.6 and σ0 takes on the value 3.15. (b) Consensus motifs with n = 5 for different μ = μ* = 2.25, μ = 5, and μ = 12 (left to right) at σ = σ* = 3.8. (c) This pattern with n = 7 is found twice in the data set. From each such subgraph two nonoverlapping layered subgraphs with n = 4 and n = 5 can be generated. (d) The number p*(σ*, μ) of subgraphs in the maximum score alignment (thick line) and the fuzziness *(σ*, μ) (thin line) as a function of μ for n = 5.

References

    1. Durbin, R., Eddy, S. R., Krogh, A. & Mitchison, G. (1998) Biological Sequence Analysis (Cambridge Univ. Press, Cambridge, U.K.).
    1. Davidson, E. H. (2001) Genomic Regulatory Systems: Development and Evolution (Academic, San Diego).
    1. Tautz, D. (2000) Curr. Opin. Genet. Dev. 1 575–579. - PubMed
    1. Uetz, P., Giot, L., Cagney, G., Mansfield, T. A., Judson, R. S., Knight, J. R., Lockshon, D., Narayan, V., Srinivasan, M., Pochart, P., et al. (2000) Nature 403 623–627. - PubMed
    1. Lockhart, D. J. & Winzeler, E. A. (2000) Nature 405 827–836. - PubMed

Publication types

LinkOut - more resources