Phospholamban structural dynamics in lipid bilayers probed by a spin label rigidly coupled to the peptide backbone
- PMID: 15448204
- PMCID: PMC521948
- DOI: 10.1073/pnas.0402801101
Phospholamban structural dynamics in lipid bilayers probed by a spin label rigidly coupled to the peptide backbone
Abstract
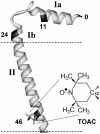
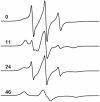
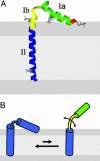
We have used chemical synthesis and electron paramagnetic resonance to probe the structural dynamics of phospholamban (PLB) in lipid bilayers. Derivatives of monomeric PLB were synthesized, each of which contained a single spin-labeled 2,2,6,6,-Tetramethyl-piperidine-N-oxyl-4-amino-4-carboxylic acid amino acid, with the nitroxide-containing ring covalently and rigidly attached to the alpha-carbon, providing direct insight into the conformational dynamics of the peptide backbone. 2,2,6,6,-tetramethyl-piperidine-N-oxyl-4-amino-4-carboxylic acid was attached at positions 0, 11, and 24 in the cytoplasmic domain or at position 46 in the transmembrane domain. The electron paramagnetic resonance spectrum of the transmembrane domain site (position 46) indicates a single spectral component corresponding to strong immobilization of the probe, consistent with the presence of a stable and highly ordered transmembrane helix. In contrast, each of the three cytoplasmic domain probes has two clearly resolved spectral components (conformational states), one of which indicates nearly isotropic nanosecond dynamic disorder. For the probe at position 11, an N-terminal lipid anchor shifts the equilibrium toward the restricted component, whereas Mg(2+) shifts it in the opposite direction. Relaxation enhancement, due to Ni(2+) ions chelated to lipid head-groups, provides further information about the membrane topology of PLB, allowing us to confirm and refine a structural model based on previous NMR data. We conclude that the cytoplasmic domain of PLB is in a dynamic equilibrium between an ordered conformation, which is in direct contact with the membrane surface, and a dynamically disordered form, which is detached from the membrane and poised to interact with its regulatory target.
Figures


Similar articles
-
Phosphorylation-dependent conformational switch in spin-labeled phospholamban bound to SERCA.J Mol Biol. 2006 May 12;358(4):1032-40. doi: 10.1016/j.jmb.2006.02.051. Epub 2006 Mar 9. J Mol Biol. 2006. PMID: 16574147
-
Backbone dynamics determined by electron paramagnetic resonance to optimize solid-phase peptide synthesis of TOAC-labeled phospholamban.Biopolymers. 2007;88(1):29-35. doi: 10.1002/bip.20618. Biopolymers. 2007. PMID: 17066471
-
Electron paramagnetic resonance reveals a large-scale conformational change in the cytoplasmic domain of phospholamban upon binding to the sarcoplasmic reticulum Ca-ATPase.Biochemistry. 2004 May 18;43(19):5842-52. doi: 10.1021/bi035749b. Biochemistry. 2004. PMID: 15134458
-
Probing the helical tilt and dynamic properties of membrane-bound phospholamban in magnetically aligned bicelles using electron paramagnetic resonance spectroscopy.Biochim Biophys Acta. 2012 Mar;1818(3):645-50. doi: 10.1016/j.bbamem.2011.11.030. Epub 2011 Dec 4. Biochim Biophys Acta. 2012. PMID: 22172806 Free PMC article.
-
Lipid interactions with transmembrane proteins.Cell Mol Life Sci. 2003 Aug;60(8):1575-80. doi: 10.1007/s00018-003-3171-z. Cell Mol Life Sci. 2003. PMID: 14513832 Free PMC article. Review.
Cited by
-
Calcium-Dependent Structural Dynamics of a Spin-Labeled RyR Peptide Bound to Calmodulin.Biophys J. 2016 Dec 6;111(11):2387-2394. doi: 10.1016/j.bpj.2016.10.025. Biophys J. 2016. PMID: 27926840 Free PMC article.
-
Structure and topology of monomeric phospholamban in lipid membranes determined by a hybrid solution and solid-state NMR approach.Proc Natl Acad Sci U S A. 2009 Jun 23;106(25):10165-70. doi: 10.1073/pnas.0904290106. Epub 2009 Jun 9. Proc Natl Acad Sci U S A. 2009. PMID: 19509339 Free PMC article.
-
Protein structural dynamics revealed by site-directed spin labeling and multifrequency EPR.Biophys Rev. 2010 May;2(2):91-99. doi: 10.1007/s12551-010-0032-5. Biophys Rev. 2010. PMID: 21687819 Free PMC article.
-
Allosteric Modulation of SERCA Pumps in Health and Disease: Structural Dynamics, Posttranslational Modifications, and Therapeutic Potential.J Mol Biol. 2025 May 9:169200. doi: 10.1016/j.jmb.2025.169200. Online ahead of print. J Mol Biol. 2025. PMID: 40349954 Review.
-
Protein-protein interactions in calcium transport regulation probed by saturation transfer electron paramagnetic resonance.Biophys J. 2012 Sep 19;103(6):1370-8. doi: 10.1016/j.bpj.2012.08.032. Biophys J. 2012. PMID: 22995510 Free PMC article.
References
-
- MacLennan, D. H., Rice, W. J. & Odermatt, A. (1997) Ann. N. Y. Acad. Sci. 834, 175-185. - PubMed
-
- Simmerman, H. K. & Jones, L. R. (1998) Physiol. Rev. 78, 921-947. - PubMed
-
- Reddy, L. G., Jones, L. R., Cala, S. E., O'Brian, J. J., Tatulian, S. A. & Stokes, D. L. (1995) J. Biol. Chem. 270, 9390-9397. - PubMed
-
- Toyofuku, T., Kurzydlowski, K., Tada, M. & MacLennan, D. H. (1994) J. Biol. Chem. 269, 22929-22932. - PubMed
-
- Colyer, J. (1993) Cardiovasc. Res. 27, 1766-1771. - PubMed
Publication types
MeSH terms
Substances
Grants and funding
LinkOut - more resources
Full Text Sources

