

Entropy of dialogues creates coherent structures in e-mail traffic
- PMID: 15448210
- PMCID: PMC521963
- DOI: 10.1073/pnas.0405728101
Entropy of dialogues creates coherent structures in e-mail traffic
Abstract
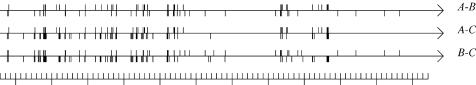
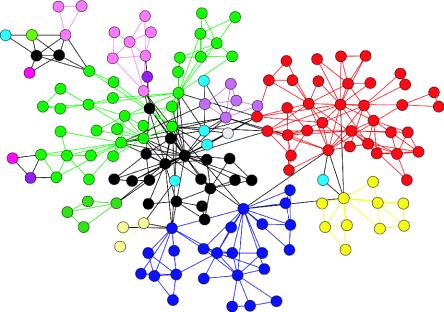
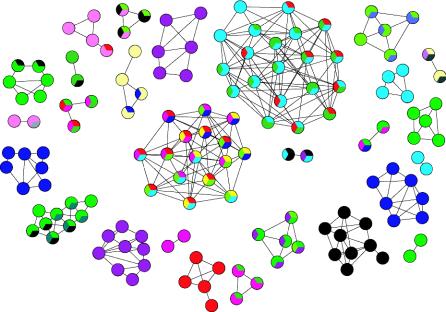
We study the dynamic network of e-mail traffic and find that it develops self-organized coherent structures similar to those appearing in many nonlinear dynamic systems. Such structures are uncovered by a general information theoretic approach to dynamic networks based on the analysis of synchronization among trios of users. In the e-mail network, coherent structures arise from temporal correlations when users act in a synchronized manner. These temporally linked structures turn out to be functional, goal-oriented aggregates that must react in real time to changing objectives and challenges (e.g., committees at a university). In contrast, static structures turn out to be related to organizational units (e.g., departments).
Figures
Similar articles
-
Spectral Entropy Based Neuronal Network Synchronization Analysis Based on Microelectrode Array Measurements.Front Comput Neurosci. 2016 Oct 18;10:112. doi: 10.3389/fncom.2016.00112. eCollection 2016. Front Comput Neurosci. 2016. PMID: 27803660 Free PMC article.
-
Inferring dynamic topology for decoding spatiotemporal structures in complex heterogeneous networks.Proc Natl Acad Sci U S A. 2018 Sep 11;115(37):9300-9305. doi: 10.1073/pnas.1721286115. Epub 2018 Aug 27. Proc Natl Acad Sci U S A. 2018. PMID: 30150403 Free PMC article.
-
Physiological synchronization and entropy as measures of team cognitive load.J Biomed Inform. 2019 Aug;96:103250. doi: 10.1016/j.jbi.2019.103250. Epub 2019 Jul 8. J Biomed Inform. 2019. PMID: 31295623 Free PMC article.
-
Efficient information theoretic strategies for classifier combination, feature extraction and performance evaluation in improving false positives and false negatives for spam e-mail filtering.Neural Netw. 2005 Jun-Jul;18(5-6):799-807. doi: 10.1016/j.neunet.2005.06.045. Neural Netw. 2005. PMID: 16111865
-
Ergonomics of electronic mail address systems: related literature review and survey of users.Ergonomics. 2001 Mar 15;44(4):382-401. doi: 10.1080/00140130010011341. Ergonomics. 2001. PMID: 11291822 Review.
Cited by
-
Epidemiologically optimal static networks from temporal network data.PLoS Comput Biol. 2013;9(7):e1003142. doi: 10.1371/journal.pcbi.1003142. Epub 2013 Jul 18. PLoS Comput Biol. 2013. PMID: 23874184 Free PMC article.
-
Diffusion on networked systems is a question of time or structure.Nat Commun. 2015 Jun 9;6:7366. doi: 10.1038/ncomms8366. Nat Commun. 2015. PMID: 26054307
-
Multidimensional human dynamics in mobile phone communications.PLoS One. 2014 Jul 28;9(7):e103183. doi: 10.1371/journal.pone.0103183. eCollection 2014. PLoS One. 2014. PMID: 25068479 Free PMC article.
-
Temporal dynamics of online petitions.PLoS One. 2017 May 18;12(5):e0178062. doi: 10.1371/journal.pone.0178062. eCollection 2017. PLoS One. 2017. PMID: 28542492 Free PMC article.
-
Universal features of correlated bursty behaviour.Sci Rep. 2012;2:397. doi: 10.1038/srep00397. Epub 2012 May 4. Sci Rep. 2012. PMID: 22563526 Free PMC article.
References
-
- Milo, R., Shen-Orr, S., Itzkovitz, S., Kashtan, N., Chklovskii, D. & Alon, U. (2002) Science 298, 824-827. - PubMed
-
- Albert, R. & Barabási, A.-L. (1999) Rev. Mod. Phys. 74, 47-97.
-
- Kleinberg, J. M. & Lawrence, S. (2001) Science 294, 1849-1850. - PubMed
-
- Cover, T. M. & Thomas, J. A. (1991) Elements of Information Theory (Wiley, New York).
LinkOut - more resources
Full Text Sources
Other Literature Sources
