

Cortical activity to vibrotactile stimulation: an fMRI study in blind and sighted individuals
- PMID: 15449356
- PMCID: PMC3697024
- DOI: 10.1002/hbm.20064
Cortical activity to vibrotactile stimulation: an fMRI study in blind and sighted individuals
Abstract
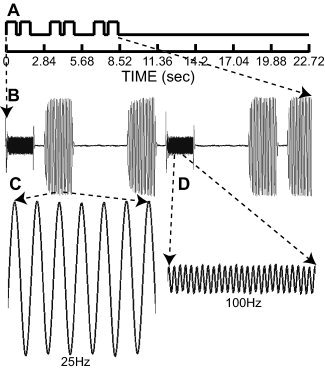
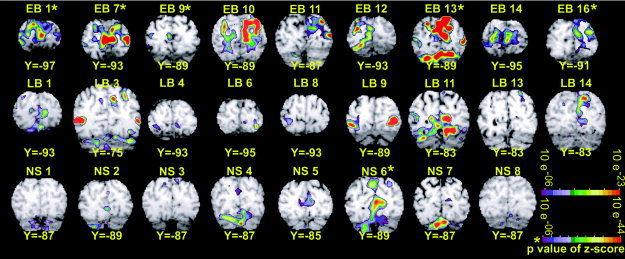
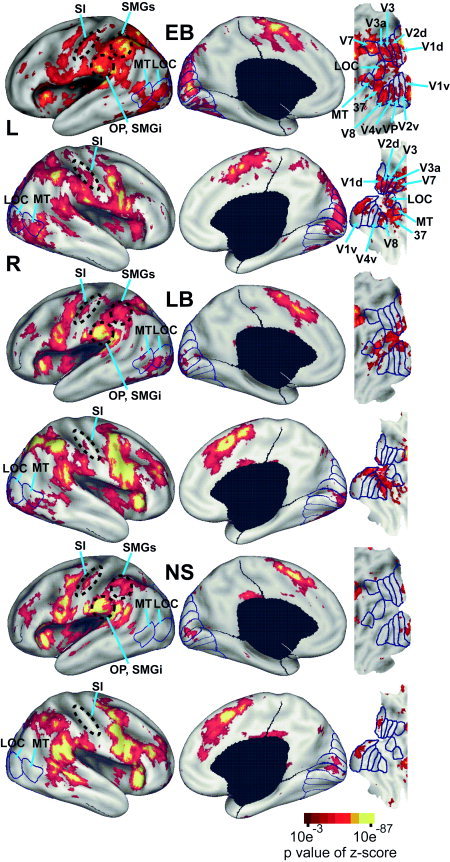
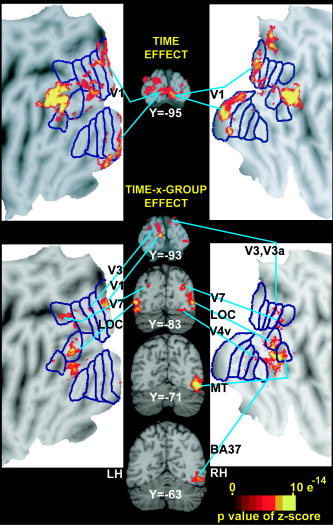
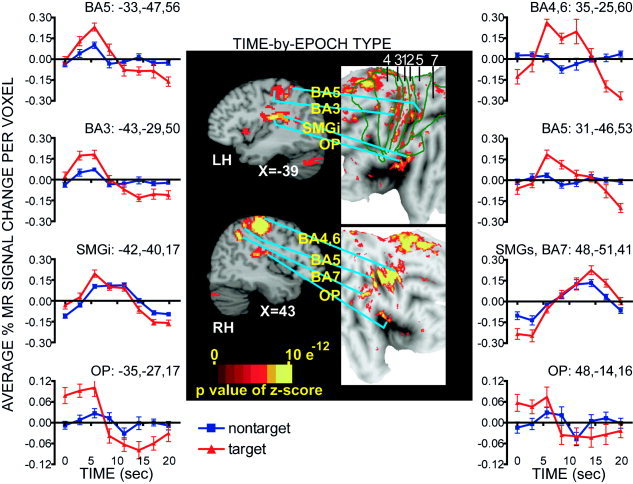
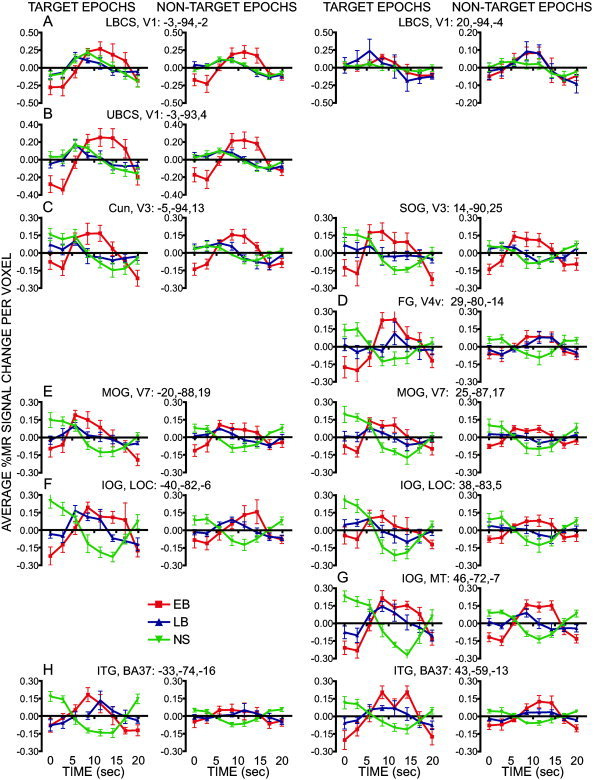
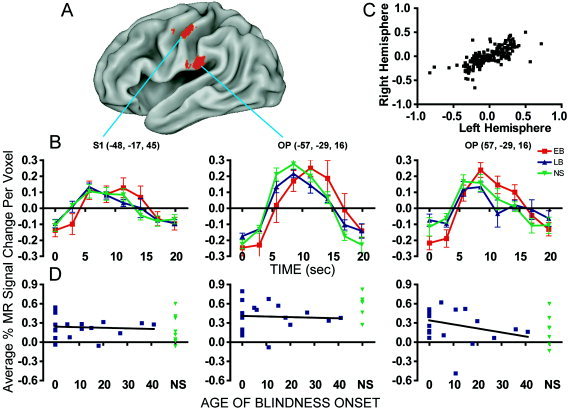
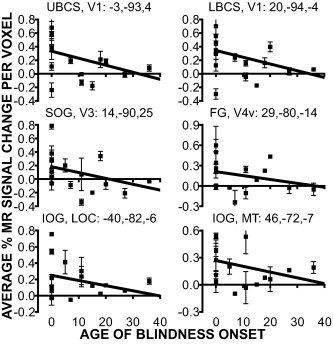
Blind individuals show visual cortex activity during Braille reading. We examined whether such cross-modal activations reflect processing somatosensory stimuli independent of language by identifying cortical activity during a one-back vibrotactile matching task. Three groups (sighted, early-onset, and late-onset [>12 years] blind) detected whether paired vibrations (25 and 100 Hz), delivered to the right index finger, differed in frequency. Three successive paired vibrations, followed by a no-stimulation interval, were presented in a long event-related design. A fixed effects average z-score analysis showed increased activity throughout the visuotopic visual cortex, where it was mostly restricted to foveal and parafoveal eccentricities. Early blind showed the most extensive distribution of activity. Late blind exhibited activity mostly in similar regions but with declining response magnitudes with age of blindness onset. Three sighted individuals had suprathreshold activity in V1 but negative responses elsewhere in visual cortex. Mixed effects ANOVA confirmed group distinctions in defined regions (V1, V3, V4v, V7, LOC, and MT). These results suggest cross-modal adaptation to tactile stimulation in visual cortex independent of language processes. All groups showed increased activity in left primary (S1) and bilateral second somatosensory areas, but without response magnitude differences between groups throughout sensorimotor cortex. Early blind showed the greatest spatial extent of S1 activity. Blind participants had more extensive bilateral activity in anterior intraparietal sulcus and supramarginal gyrus. Extensive usage of touch in Braille reading may underlie observed S1 expansions in the reading finger representation. In addition, learned attentiveness to touch may explain similar expansion of parietal tactile attention regions.
Figures
Similar articles
-
Reading embossed capital letters: an fMRI study in blind and sighted individuals.Hum Brain Mapp. 2006 Apr;27(4):325-39. doi: 10.1002/hbm.20188. Hum Brain Mapp. 2006. PMID: 16142777 Free PMC article.
-
Adaptive changes in early and late blind: a fMRI study of Braille reading.J Neurophysiol. 2002 Jan;87(1):589-607. doi: 10.1152/jn.00285.2001. J Neurophysiol. 2002. PMID: 11784773 Free PMC article. Clinical Trial.
-
Adaptive changes in early and late blind: a FMRI study of verb generation to heard nouns.J Neurophysiol. 2002 Dec;88(6):3359-71. doi: 10.1152/jn.00129.2002. J Neurophysiol. 2002. PMID: 12466452 Free PMC article.
-
Plasticity of multisensory dorsal stream functions: evidence from congenitally blind and sighted adults.Restor Neurol Neurosci. 2010;28(2):193-205. doi: 10.3233/RNN-2010-0500. Restor Neurol Neurosci. 2010. PMID: 20404408 Review.
-
Behavioral and neuroplastic changes in the blind: evidence for functionally relevant cross-modal interactions.J Physiol Paris. 2004 Jan-Jun;98(1-3):221-33. doi: 10.1016/j.jphysparis.2004.03.009. J Physiol Paris. 2004. PMID: 15477034 Review.
Cited by
-
Beat Detection Recruits the Visual Cortex in Early Blind Subjects.Life (Basel). 2021 Mar 31;11(4):296. doi: 10.3390/life11040296. Life (Basel). 2021. PMID: 33807372 Free PMC article.
-
Reading embossed capital letters: an fMRI study in blind and sighted individuals.Hum Brain Mapp. 2006 Apr;27(4):325-39. doi: 10.1002/hbm.20188. Hum Brain Mapp. 2006. PMID: 16142777 Free PMC article.
-
Brain Morphological Modifications in Congenital and Acquired Auditory Deprivation: A Systematic Review and Coordinate-Based Meta-Analysis.Front Neurosci. 2022 Mar 28;16:850245. doi: 10.3389/fnins.2022.850245. eCollection 2022. Front Neurosci. 2022. PMID: 35418829 Free PMC article.
-
Diffusion tensor imaging reveals white matter reorganization in early blind humans.Cereb Cortex. 2006 Nov;16(11):1653-61. doi: 10.1093/cercor/bhj102. Epub 2005 Dec 28. Cereb Cortex. 2006. PMID: 16400157 Free PMC article.
-
Recruitment of occipital cortex during sensory substitution training linked to subjective experience of seeing in people with blindness.PLoS One. 2011;6(8):e23264. doi: 10.1371/journal.pone.0023264. Epub 2011 Aug 10. PLoS One. 2011. PMID: 21853098 Free PMC article.
References
-
- Allard T, Clark SA, Jenkins WM, Merzenich MM (1991): Reorganization of somatosensory area 3b representations in adult owl monkeys after digital syndactyly. J Neurophysiol 66: 1048–1058. - PubMed
-
- Amedi A, Jacobson G, Hendler T, Malach R, Zohary E (2002): Convergence of visual and tactile shape processing in the human lateral occipital complex. Cereb Cortex 12: 1202–12. - PubMed
-
- Amedi A, Raz N, Pianka P, Malach R, Zohary E (2003): Early 'visual' cortex activation correlates with superior verbal memory performance in the blind. Nat Neurosci 6: 758–66. - PubMed
-
- Andersson JL, Sundin A, Valind S (1995): A method for coregistration of PET and MR brain images. J Nucl Med 36: 1307–1315. - PubMed
-
- Arno P, De Volder AG, Vanlierde A, Wanet‐Defalque MC, Streel E, Robert A, Sanabria‐Bohorquez S, Veraart C (2001): Occipital activation by pattern recognition in the early blind using auditory substitution for vision. Neuroimage 13: 632–645. - PubMed
Publication types
MeSH terms
Substances
Grants and funding
LinkOut - more resources
Full Text Sources
Medical
