Comparative Study
. 2004 Oct;20(8):2225-34.
doi: 10.1111/j.1460-9568.2004.03670.x.

Bimodal speech: early suppressive visual effects in human auditory cortex

Affiliations
Comparative Study

Bimodal speech: early suppressive visual effects in human auditory cortex

Julien Besle et al. Eur J Neurosci. 2004 Oct.

Abstract

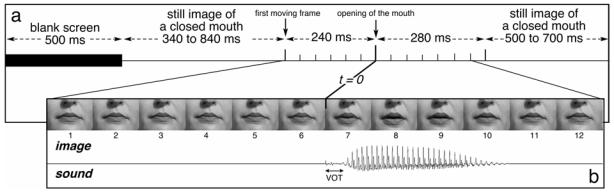
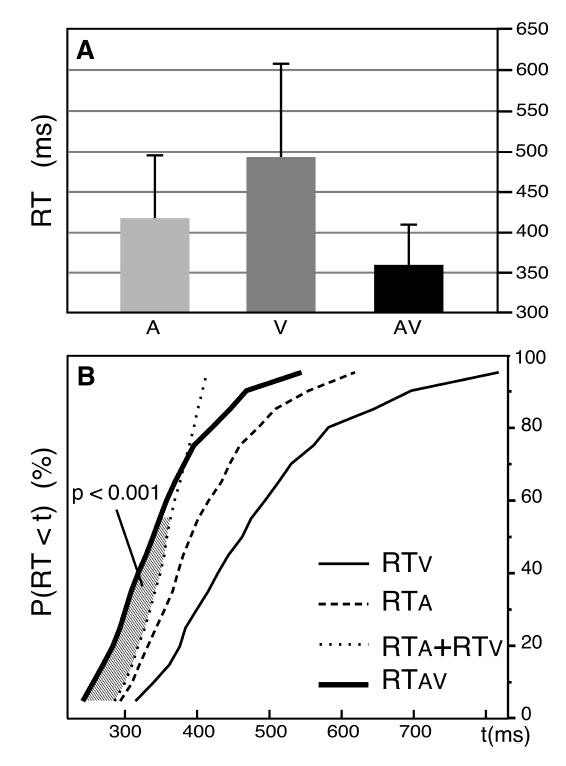
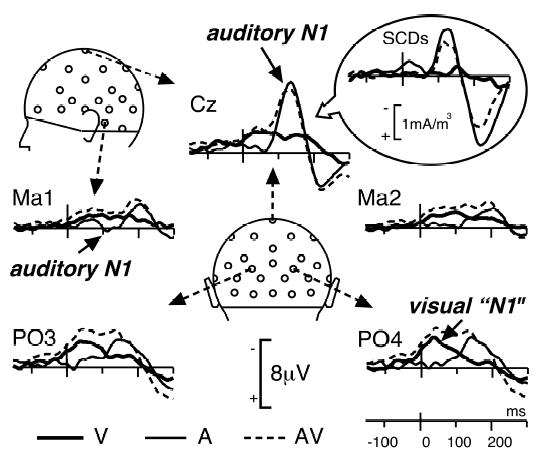
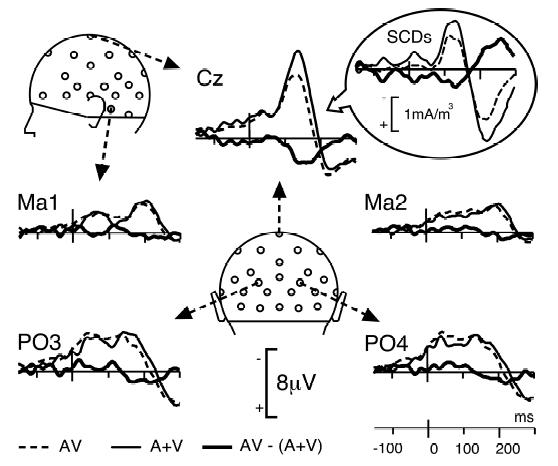
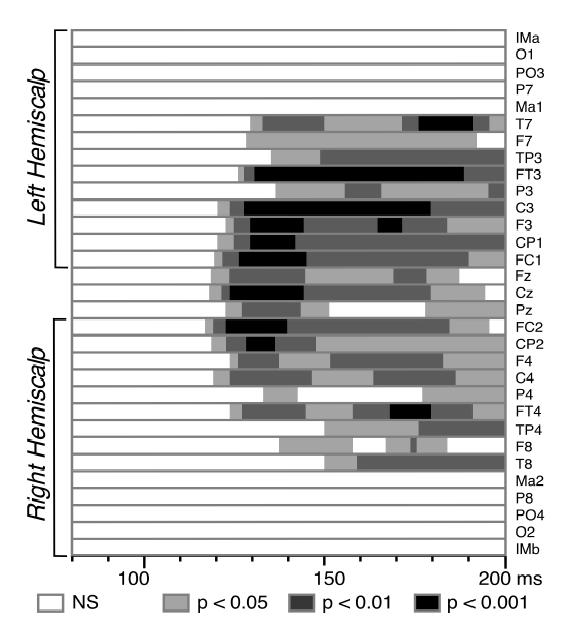
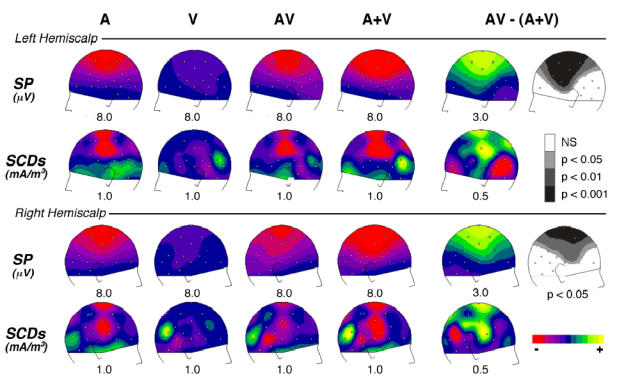
While everyone has experienced that seeing lip movements may improve speech perception, little is known about the neural mechanisms by which audiovisual speech information is combined. Event-related potentials (ERPs) were recorded while subjects performed an auditory recognition task among four different natural syllables randomly presented in the auditory (A), visual (V) or congruent bimodal (AV) condition. We found that: (i) bimodal syllables were identified more rapidly than auditory alone stimuli; (ii) this behavioural facilitation was associated with cross-modal [AV-(A+V)] ERP effects around 120-190 ms latency, expressed mainly as a decrease of unimodal N1 generator activities in the auditory cortex. This finding provides evidence for suppressive, speech-specific audiovisual integration mechanisms, which are likely to be related to the dominance of the auditory modality for speech perception. Furthermore, the latency of the effect indicates that integration operates at pre-representational stages of stimulus analysis, probably via feedback projections from visual and/or polymodal areas.


Figures

Figure 1
Figure 1. Time-Course of an Auditory-Visual non-Target Trial
Each trial began with the presentation of a blank screen for 500 ms. Then a still image of a closed mouth was displayed during a random period of 340–840 ms. The mouth began to move 240 ms (6 frames) before opening (time zero). Then, the corresponding sound was played. The lip movement ended 280 ms after time zero with an image of the closed mouth that remained for a random time of 500–700 ms for non-target trials, and until the key press for target trials (or for 1500 ms if the subject did not respond). In the visual-only condition, the time course was similar except that the sound was not played. In the auditory-only condition, the mouth remained closed all along the trial. (VOT = Voice Onset Time)
Figure 2
Figure 2. Violation of the Race Model Inequality in the Behavioural-only Experiment
A: Mean reaction times for the auditory, visual and audiovisual trials. B: Cumulative probability density functions (CDFs) of the reaction times in the three (A, V, AV) conditions of presentation, pooled across subjects. The stimuli and procedure were similar to those used in the main experiment, except that subjects responded to the targets in the 3 conditions. For shorter reaction times, the CDF for AV responses (thick line) is above the sum of the A and V CDFs (thin dotted line). The hatched area between these two curves illustrates the fractiles for which the violation of the race model inequality [P(RTAV < t) ≤ P(RTA < t) + P(RTV < t)] is statistically significant (p<0.001).
Figure 3
Figure 3. Unimodal and Bimodal Responses
Grand-average ERPs at 5 illustrative electrodes in each of the 3 conditions of presentation (A, V, AV) from 150 ms before time zero to 300 ms after. The unimodal auditory N1 wave peaks at 136 ms post-stimulus around Cz with small polarity reversals at mastoid sites (Ma1 and Ma2). The visual “N1” wave is maximum around occipito-parietal electrodes (PO3 and PO4) at about 40 ms after time zero (this short latency is due to the fact that lip movements began before time zero). Insert: Grand-average SCDs at Cz are presented to illustrate the difficulty of interpreting interaction effects locally (see Footnote 1).
Figure 4
Figure 4. Bimodal vs Sum of Unimodal Responses
Comparison of the response to bimodal AV stimuli (dotted lines) with the sum (A+V) of the unimodal responses (thin lines) at 5 illustrative electrodes, from −150 to 300 ms. The AV response closely follows the A+V trace, except at central sites (illustrated here at Cz) where the two traces significantly differ from about 120 to 190 ms after time zero (see Figure 5). Insert: For homogeneity with Figure 3, grand-average SCDs are also presented at this electrode.
Figure 5
Figure 5. Statistical Significance of the Auditory-Visual Interactions
Results of the Student’s t-tests -(N=15 subjects) comparing the [AV − (A+V)] amplitudes to zero at each latency from 80 to 200 ms after time zero. Electrodes at the centre of the figure correspond to frontal and central sites and those at the extrema (top and bottom) to more lateral sites. Significant interactions start around 120 ms over fronto-central areas with stronger effects (P < 0.001) on the left hemiscalp.
Figure 6
Figure 6. Comparison of the AV Interactions with the Auditory N1 Wave
Scalp potential (SP) and current density (SCD) topographies over the left and right hemiscalps, at the latency of the unimodal auditory N1 wave (136 ms). Each row displays: left part, the distributions of the auditory (A), visual (V), bimodal (AV) responses and the sum of auditory and visual (A+V) responses; right part, the distributions of the [AV − (A+V)] interaction pattern with the associated Student’s t-map -estimated on potential values at the same latency (136 ms). The grey colours in t-maps -indicate the scalp areas where [AV − (A+V)] significantly differs from zero. In potential and SCD maps, half the range of the scale (in μV or mA/m3) is given below each map. The topography of the crossmodal interaction pattern is similar to that of the unimodal auditory N1 wave, but with opposite polarities. This interaction could therefore reflect a decrease of the unimodal N1 response in auditory cortex.

References

    1. Alcaini M, Giard MH, Thevenet M, Pernier J. Two separate frontal components in the N1 wave of the human auditory evoked response. Psychophysiology. 1994;31:611–615. - PubMed
    1. Arnold P, Hill F. Bisensory augmentation: A speechreading advantage when speech is clearly audible and intact. Br J Psychol. 2001;92:339–355. - PubMed
    1. Barth DS, Goldberg N, Brett B, Di S. The spatiotemporal organization of auditory, visual and auditory-visual evoked potentials in rat cortex. Brain Res. 1995;678:177–190. - PubMed
    1. Bense S, Stephan T, Yousry TA, Brandt T, Dieterich M. Multisensory cortical signal increases and decreases during vestibular galvanic stimulation (fMRI) J Neurophysiol. 2001;85:886–899. - PubMed
    1. Besle J, Fort A, Giard M-H. Interest and validity of the additive model in electrophysiological studies of multisensory interactions. Cognitive Processing (in press)

Publication types