. 2004 Dec 3;279(49):51545-53.
doi: 10.1074/jbc.M408573200. Epub 2004 Sep 26.

Macrophage tropism of HIV-1 depends on efficient cellular dNTP utilization by reverse transcriptase

Affiliations

Macrophage tropism of HIV-1 depends on efficient cellular dNTP utilization by reverse transcriptase

Tracy L Diamond et al. J Biol Chem. .

Abstract

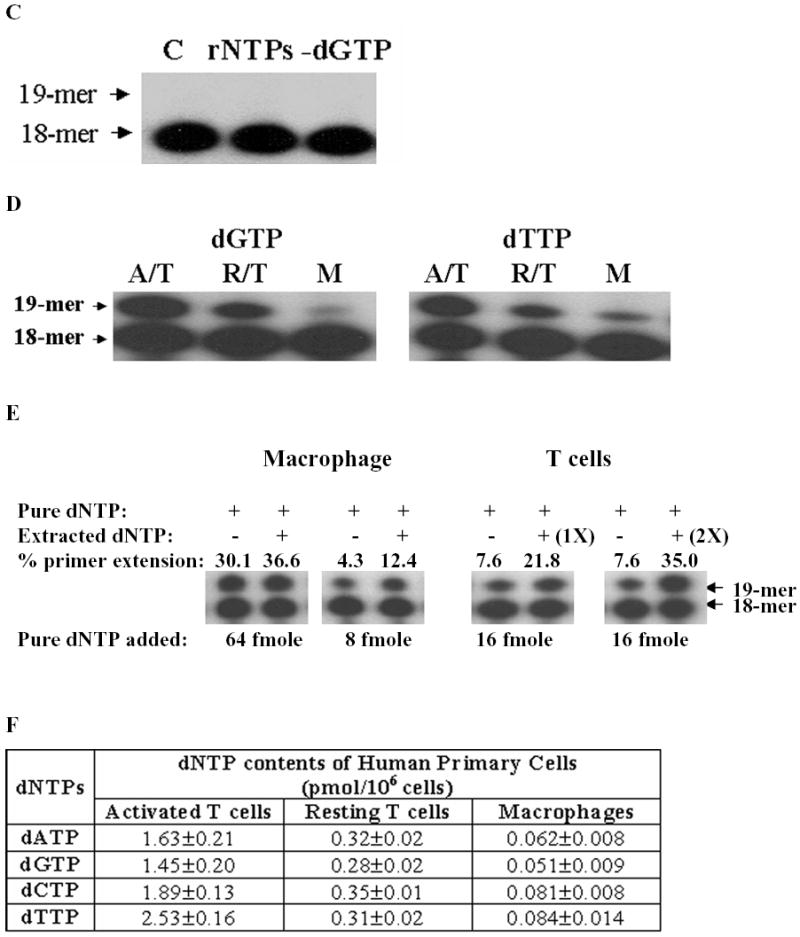
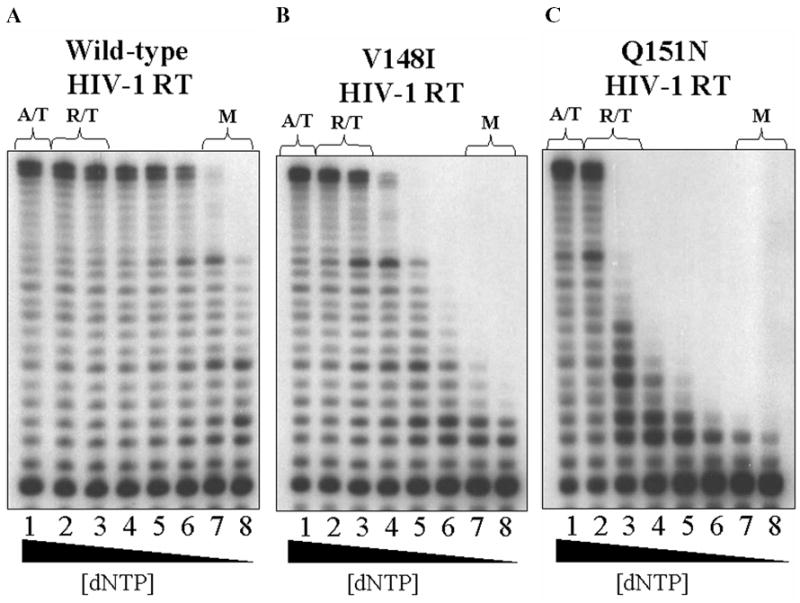
Retroviruses utilize cellular dNTPs to perform proviral DNA synthesis in infected host cells. Unlike oncoretroviruses, which replicate in dividing cells, lentiviruses, such as human immunodeficiency virus type 1 (HIV-1) and simian immunodeficiency virus, are capable of efficiently replicating in non-dividing cells (terminally differentiated macrophages) as well as dividing cells (i.e. activated CD4+ T cells). In general, non-dividing cells are likely to have low cellular dNTP content compared with dividing cells. Here, by employing a novel assay for cellular dNTP content, we determined the dNTP concentrations in two HIV-1 target cells, macrophages and activated CD4+ T cells. We found that human macrophages contained 130-250-fold lower dNTP concentrations than activated human CD4+ T cells. Biochemical analysis revealed that, unlike oncoretroviral reverse transcriptases (RTs), lentiviral RTs efficiently synthesize DNA even in the presence of the low dNTP concentrations equivalent to those found in macrophages. In keeping with this observation, HIV-1 vectors containing mutant HIV-1 RTs, which kinetically mimic oncoretroviral RTs, failed to transduce human macrophages despite retaining normal infectivity for activated CD4+ T cells and other dividing cells. These results suggest that the ability of HIV-1 to infect macrophages, which is essential to establishing the early pathogenesis of HIV-1 infection, depends, at least in part, on enzymatic adaptation of HIV-1 RT to efficiently catalyze DNA synthesis in limited cellular dNTP substrate environments.


Figures

Figure 1
Figure 1. Primary cell dNTP content determination by the HIV-1 RT-based dNTP assay.
A) dCTP and dTTP incorporation by HIV-1 RT (60 nM) was measured using the dCTP-specific template/primer pair (200 fmole) in the presence of different amounts of dCTP. (B) Standard curve for the incorporation of dTTP and dGTP onto the dTTP and dGTP-specific template/primer pairs. The percent primer extension in each reaction was plotted after background normalization (see Methods). Each data point was calculated from three independent reactions; error bars denote the standard deviation from the mean. (C) Incorporation of incorrect dNTPs and rNTPs. The G-specific template/primer pair was incubated with HIV-1 RT (60 nM) and 50 μM rNTPs (“rNTPs”) or a mixture of three incorrect dNTPs (“-dGTP”; this corresponds to a mixture that contained 0.5 μM of each dTTP, dCTP and dATP). (D) dNTP samples were isolated from human activated (A/T) or resting (R/T) CD4+ T cells or CD14+ macrophages (M). dNTP samples contained in 1 (T cells) ~ 2 (macrophages) ×105 cells were used for each assay reaction using dGTP- or dTTP- specific template/primer pairs. (E) Effect of other chemicals contained in the extracted dNTP samples. The dNTP assay was performed with ether only pure dNTP or mixtures of pure and extracted dNTPs. The amounts of the pure dNTPs used in the reactions were shown at the bottom of the figure, and 1 (T cells) or 2 (macrophages) μl of the cellular dNTP sample was used. The percent of primer extension in each reaction is also shown. Two different amounts of the T cell dNTP sample, 1X and 2X, were used. The results for all template/primer pairs with the extracted dNTP samples are summarized in (F). dNTP values shown represent mean values calculated from three independent experiments performed in triplicate; standard deviations are shown for each value. All reactions were performed as described in Methods, and products were analyzed by electrophoresis through 14% denaturing polyacrylamide gels, followed by PhosphorImager analysis (see Methods).
Figure 2
Figure 2. Comparison of reverse transcription capability of lentiviral and oncoretroviral RTs at different dNTP concentrations.
A 32P-labeled 17-mer primer (S) was annealed to a 38-mer RNA template and then extended by two lentiviral RTs (A), HIV-1 and SIV RTs, and two oncoretroviral RTs (B), MuLV and AMV RTs, in reactions containing 4 μM of each dNTP. Two different input levels of RT activity were used in these reactions (1× and 4×, as indicated). The RT reactions were repeated with these same two reverse transcription activities (4× and 1×) in reactions that contained 0.04 μM of each dNTP; the fully extended primer is 38 nt long (F). 4X concentrations of RTs are as follows: HIV-1 RT, 3.2 nM; SIV RT, 6 nM; MuLV RT, 0.5 nM; AMV RT, 2.25 nM. The same T/P used in (A) and (B) was extended by HIV-1 (3.2nM) and MuLV RTs (0.5nM) under the condition allowing a single round of primer extension at 0.04 μM dNTP (C). A 32P-labeled 20-mer primer (S) annealed to a 120nt long RNA template encoding HIV-1 RT genome (D) was extended by the four RT under the same condition used in (A) and (B). The 2X concentration was used for the two lentiviral RTs (H, 6.4nM HIV-1 RT and S, 12nM SIV RT), whereas the 8X concentration was used for the two oncoretroviral RTs (M, 4nM MuLV RT and A, 9nM AMV RT). (E) dNTP concentration dependent single nucleotide incorporation by MuLV and HIV-1 RTs was determined on the 18-mer/19-mer assay T/Ps. The single nucleotide incorporation activity of these two DNA polymerases at different dNTP concentrations was analyzed using the T-specific template/primer pair (10 nM) in the presence of decreasing dTTP concentrations (50, 5, 0.5, and 0.05 μM). The 18-mer and 19-mer primers indicate unextended and extended primers, respectively. Polymerase concentrations showing approximately 60% primer extension on this template/primer pair at 50 μM TTP are MuLV RT, 1 nM and HIV-1 RT, 0.8 nM. (F) Steady state kinetic analysis of the two DNA polymerases with the four 18mer/19mer T/Ps is shown (see Methods). Results are from experiments performed in triplicate with standard deviations.
Figure 3
Figure 3. dNTP dependence of HIV-1 WT (A), V148I (B), and Q151N (C) RT mutants during multiple round polymerization.
The 32P-labelled 17-mer primer annealed to the 38-mer RNA template was extended by equivalent activities of the three RTs (as determined by analysis of enzymatic activity under reaction conditions that contained 5 μM of each dNTP). Reactions were then conducted with decreasing equimolar concentrations of all four dNTPs, and were analyzed on a 14% denaturing polyacrylamide gel. Lanes 1–8 correspond to 5, 2.5, 1, 0.5, 0.25, 0.1, 0.05, and 0.025 μM concentrations of all four dNTPs, respectively. Reactions performed at concentrations that represent those found in activated (A/T) and resting (R/T) T cells and macrophages (M) are marked.
Figure 4
Figure 4. Transduction of primary human cells by pseudotyped lentivirus vectors containing WT, V148I, or Q151N RTs.
Primary human cells were infected with eGFP-encoding lentivirus vectors containing the indicated RT variants (WT, V148I, Q151N). T cells were fixed 48h post-infection with 0.5% formaldehyde and macrophages were fixed 120h post-infection in 0.5% formaldehyde after treatment with 2mM EDTA and gentle scraping. Flow cytometric analysis of eGFP expression in transduced CD4+ T cells (A) and macrophages (B) from one representative experiment are shown. The negative control (mock) infections are shown in black, while results from vector-transduced cells depicted by the green histograms. Total cells were gated on the basis of physical parameters (forward and side scatter) and the percent GFP-positive cells was determined after setting gating parameters such that the %-GFP positive in the negative control cells was 1%. (C) Representative images of macrophages 120h post-infection are shown. Fluorescent images are shown below (upper panels) with corresponding bright field images (lower panels); images were taken at 14× magnification. A summary of flow cytometric results from one experiment performed in triplicate is also shown in (D).

Similar articles

Cited by

References

    1. Traut TW. Mol Cell Biochem. 1994;140:1–22. - PubMed
    1. Angus SP, Wheeler LJ, Ranmal SA, Zhang X, Markey MP, Mathews CK, Knudsen ES. J Biol Chem. 2002;277:44376–44384. - PubMed
    1. Jackson RC, Lui MS, Boritzki TJ, Morris HP, Weber G. Cancer Res. 1980;40:1286–291. - PubMed
    1. Hauschka PV. Methods Cell Biol. 1973;7:361–462. - PubMed
    1. Fuller SA, Hutton JJ, Meier J, Coleman MS. Biochem J. 1982;206:131–138. - PMC - PubMed

Publication types

MeSH terms