. 2004 Dec 10;279(50):52535-42.
doi: 10.1074/jbc.M409680200. Epub 2004 Sep 27.

Altered amyloid-beta metabolism and deposition in genomic-based beta-secretase transgenic mice

Affiliations

Altered amyloid-beta metabolism and deposition in genomic-based beta-secretase transgenic mice

Matthew J Chiocco et al. J Biol Chem. .

Abstract

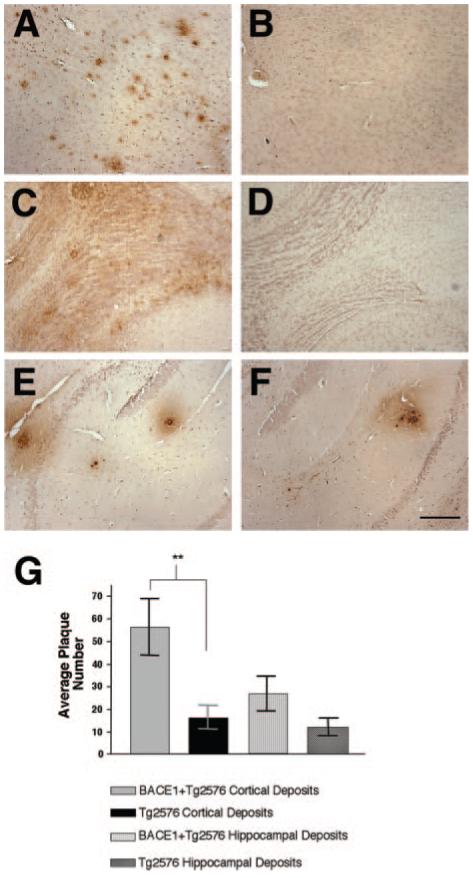
Amyloid-beta (Abeta) the primary component of the senile plaques found in Alzheimer's disease (AD) is generated by the rate-limiting cleavage of amyloid precursor protein (APP) by beta-secretase followed by gamma-secretase cleavage. Identification of the primary beta-secretase gene, BACE1, provides a unique opportunity to examine the role this unique aspartyl protease plays in altering Abeta metabolism and deposition that occurs in AD. The current experiments seek to examine how modulating beta-secretase expression and activity alters APP processing and Abeta metabolism in vivo. Genomic-based BACE1 transgenic mice were generated that overexpress human BACE1 mRNA and protein. The highest expressing BACE1 transgenic line was mated to transgenic mice containing human APP transgenes. Our biochemical and histochemical studies demonstrate that mice overexpressing both BACE1 and APP show specific alterations in APP processing and age-dependent Abeta deposition. We observed elevated levels of Abeta isoforms as well as significant increases of Abeta deposits in these double transgenic animals. In particular, the double transgenics exhibited a unique cortical deposition profile, which is consistent with a significant increase of BACE1 expression in the cortex relative to other brain regions. Elevated BACE1 expression coupled with increased deposition provides functional evidence for beta-secretase as a primary effector in regional amyloid deposition in the AD brain. Our studies demonstrate, for the first time, that modulation of BACE1 activity may play a significant role in AD pathogenesis in vivo.


Figures

Fig. 1
Fig. 1. Generation of genomic-based human BACE1 transgenic mice
A, top genomic map of the BACE1 locus with the relative position of the BACE1 gene (as represented by the STS A005A12), nearby genes and STSs, and corresponding BAC clones on chromosome 11q23.3. (bottom) human BACE1 transgenics recovered by pronuclear microinjection. Founders were recovered for three different BAC clones shown at right. Plus (+) signs indicate PCR-positive animals for the corresponding STSs and primers at the chromosome 11 locus. B and C, genomic DNA from BACE1 transgenic (Tg), nontransgenic littermate (NT), human genomic (Hu), and/or 794I11 BAC DNA was digested with BamHI, run on agarose gel, transferred to nylon membrane and hybridized with a 32P-labeled human BACE1 cDNA (B) and human Alu repetitive element (C). On the left are shown the sizes of molecular weight markers in kbp.
Fig. 2
Fig. 2. Human BACE1 mRNA and protein expression and quantitation
A, RT-PCR analysis with conserved primers corresponding to sequences identical between mouse and human Bace1/BACE1 mRNAs was performed on reverse-transcribed RNA from brain, kidney, liver, heart, colon, spleen, lung, testes, and ear from nontransgenic (NT) and human BACE1 transgenic (Tg) mice. The resulting 446 bp products were digested with BglII to generate 324 and 122 bp mBace fragments, while the human products (hBACE) remain undigested. Left, approximate sizes in bp. B, relative levels of human BACE1 mRNA: mouse Bace1 mRNA in brain. Human BACE1 mRNA is expressed 4.7-fold higher than mouse Bace1 mRNA (two-tailed Student’s t test, p value = 0.017, error bars represent S.E.). C, Western blot analysis of mouse and human BACE1 in 1% CHAPS brain extracts. Twenty micrograms of total protein from 8-week-old nontransgenic control (Ctl), BACE1 transgenic (Tg), and mouse Bace1 KO mice were run on 8% Tris-glycine gels, transferred to polyvinylidene difluoride membrane, and blotted with C-terminal antibody BACE-00/6. On the left for each gel are sizes of molecular mass markers in kilodaltons. D, BACE1 protein expression was quantitated by comparing the amount of BACE1 protein in transgenic (n = 9) and nontransgenic (n = 9) brain tissue extracts relative to a standard curve of Bace1 expression using a fluorescence imager for capture of chemiluminescent signal. Human BACE1 is expressed ∼2-fold higher than control (two-tailed Student’s t test, p value < 0.0001).
Fig. 3
Fig. 3. Human BACE1 immunohistochemical localization
Brains from 2-month-old BACE1 transgenic (B, D, F) and nontransgenic (A, C, E) animals were cryoprotected in 30% sucrose after perfusion with 4% paraformaldehyde. Sagittal sections were analyzed by staining with polyclonal antibody B279 followed by staining with biotinylated anti-goat secondary antibody (A-F) or Alexa-488-conjugated secondary antibody (G and H). Positive immunoreactivity is present in the olfactory bulb (A and B), hippocampus (C and D), and frontal cortex (E and F). Scale bar in F and H = 200 μm.
Fig. 4
Fig. 4. APP processing and Aβ metabolism in BACE1 transgenics
A, Western blot analysis of APP holoprotein (top) and APP C-terminal fragments (bottom) in 1% CHAPS brain extracts. Twenty micrograms of total protein from ∼2 month-old progeny of BACE1 transgenics crossed to Tg2576 (APP cDNA) transgenic animals were run on 4-12% Bis-Tris gradient gels, transferred to polyvinylidene difluoride membrane, and blotted with APP C-terminal polyclonal antibody 369. On the left are sizes of molecular mass makers in kilodaltons. B, quantitation of relative band intensities of APP C-terminal fragments using chemiluminescence with each brain extract analyzed in triplicate. The ratio of CTF-β: (CTF-β+CTF-α) was compared in animals transgenic for both BACE1 and Tg2576 (n = 6) to animals transgenic for Tg2576 alone (n = 7). Double transgenics had significantly higher APP CTF ratios by two-tailed Student’s t test, p value = 0.0003. C, brain extracts from ∼2-month-old animals were analyzed by ELISA. BACE1/Tg2576 animals (n = 5) had significantly higher levels of Aβ1-40 compared with Tg2576 alone (n = 5) by two-tailed Student’s t test, p value = 0.0040.
Fig. 5
Fig. 5. Analysis of amyloid-β deposition in BACE1 transgenic animals
Brains from 12-month-old animals were fixed in 10% formalin, embedded in paraffin, and sectioned on a sagittal plane (10-μm thick). Scattered sections were analyzed by staining using standard protocols (Kulnane and Lamb, Ref. 27) with mAb 6E10, which detects amino acids 1-17 in the Aβ region. Brain sections of animals transgenic for both BACE1 and Tg2576 in cortex (A), olfactory bulb (C), and hippocampus (E). Brain sections of animals transgenic for Tg2576 alone in cortex (B), olfactory bulb (D), and hippocampus (F). A similar pattern of Aβ immunostaining was observed in all double BACE1/Tg2576 transgenics and single Tg2576 transgenics. Scale bar in F = 200 μm. G, immunopositive plaques were counted in sections (5 sections/animal) from each animal transgenic for both BACE1 and Tg2576 (n = 6) as well as Tg2576 alone (n = 6) using Image-Pro Plus (Mediacybernetics, Silver Spring, MD) to identify Aβ deposits in each brain region. The average plaque number is significantly higher in cortical brain regions of the double transgenics compared with single transgenics (**, two-tailed Student’s t test with Welch’s correction, p value = 0.0252, error bars represent S.E.), while hippocampal deposits are not statistically different between both groups.
Fig. 6
Fig. 6. Amyloid-β production and BACE1 protein expression by brain region
A and B, brain region extracts from 12-month-old progeny of BACE1 transgenics crossed to Tg2576 transgenics were made using a sequential extraction procedure (see “Materials and Methods”) and analyzed by ELISA. A, soluble Aβ1-40 levels by brain region. BACE1/Tg2576 animals had significantly higher levels of Aβ in olfactory bulb (#, two-tailed Student’s t test, p value = 0.0163) and cortex (*, two-tailed Student’s t test, p value = 0.0034) compared with Tg2576 animals. B, insoluble Aβ1-40 levels by brain region. BACE1/Tg2576 animals had significantly higher levels of Aβ in olfactory bulb (**, two-tailed Student’s t test, p value = 0.0157), hippocampus (††, two-tailed Student’s t test, p value = 0.0004), and cortex (*, Student’s two-tailed t test, p value = 0.0016) compared with Tg2576 animals. C, BACE1 protein expression was quantitated using Western blot analysis by comparing the amount of BACE1 protein in cerebellum, olfactory bulb, hippocampus, and cortex tissue extracts (n = 7 for each brain region) relative to a standard curve of BACE1 expression using a fluorescence imager to capture chemiluminescent signal. Human BACE1 expressed in olfactory bulb is significantly higher than cortex, hippocampus, and cerebellum (ANOVA, p value < 0.001); while cortical BACE1 expression is significantly higher than hippocampus (ANOVA, p value < 0.05) and cerebellum (ANOVA, p value < 0.001).

References

    1. Tanzi RE. J. Clin. Investig. 1999;104:1175–1179. - PMC - PubMed
    1. Glenner GG, Wong CW. Biochem. Biophys. Res. Commun. 1984;120:885–890. - PubMed
    1. Braak H, Braak E. Neurobiol. Aging. 1997;18:351–357. - PubMed
    1. Vassar R, Bennett BD, Babu-Khan S, Kahn S, Mendiaz EA, Denis P, Teplow DB, Ross S, Amarante P, Loeloff R, Luo Y, Fisher S, Fuller J, Edenson S, Lile J, Jarosinski MA, Biere AL, Curran E, Burgess T, Louis JC, Collins F, Treanor J, Rogers G, Citron M. Science. 1999;286:735–741. - PubMed
    1. Cai H, Wang Y, McCarthy D, Wen H, Borchelt DR, Price DL, Wong PC. Nat. Neurosci. 2001;4:233–234. - PubMed

Publication types

MeSH terms

LinkOut - more resources