Comparative Study
. 2004 Oct 4;200(7):883-94.
doi: 10.1084/jem.20040495. Epub 2004 Sep 27.

The loss of PTEN allows TCR alphabeta lineage thymocytes to bypass IL-7 and Pre-TCR-mediated signaling

Affiliations
Comparative Study

The loss of PTEN allows TCR alphabeta lineage thymocytes to bypass IL-7 and Pre-TCR-mediated signaling

Thijs J Hagenbeek et al. J Exp Med. .

Abstract

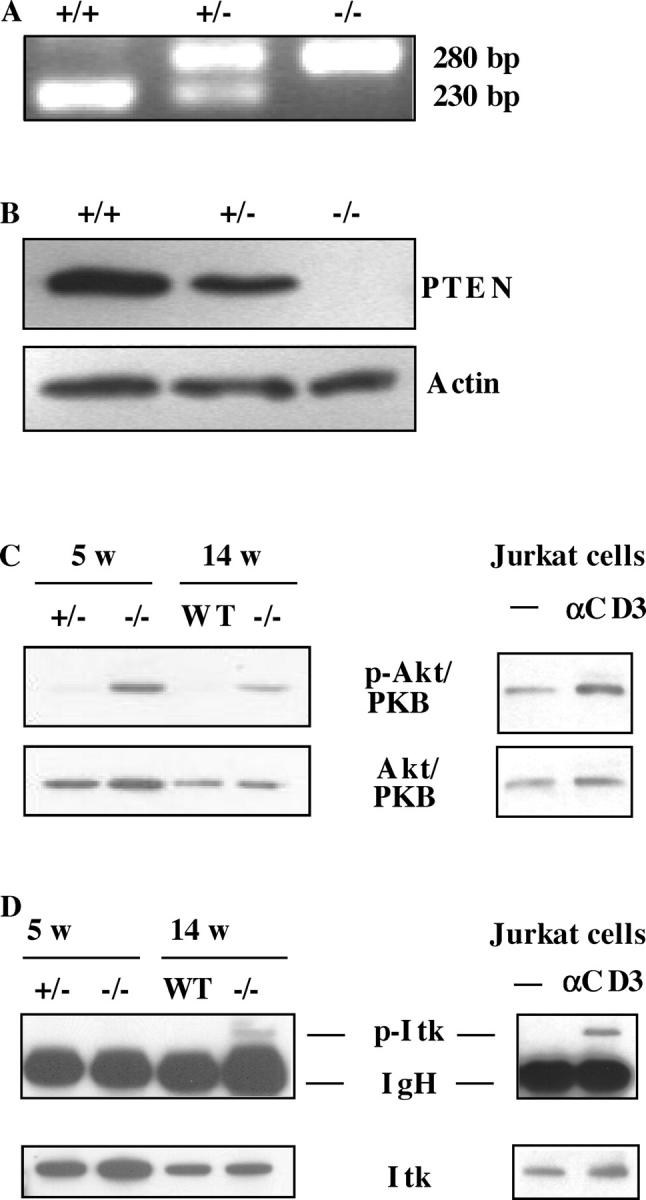
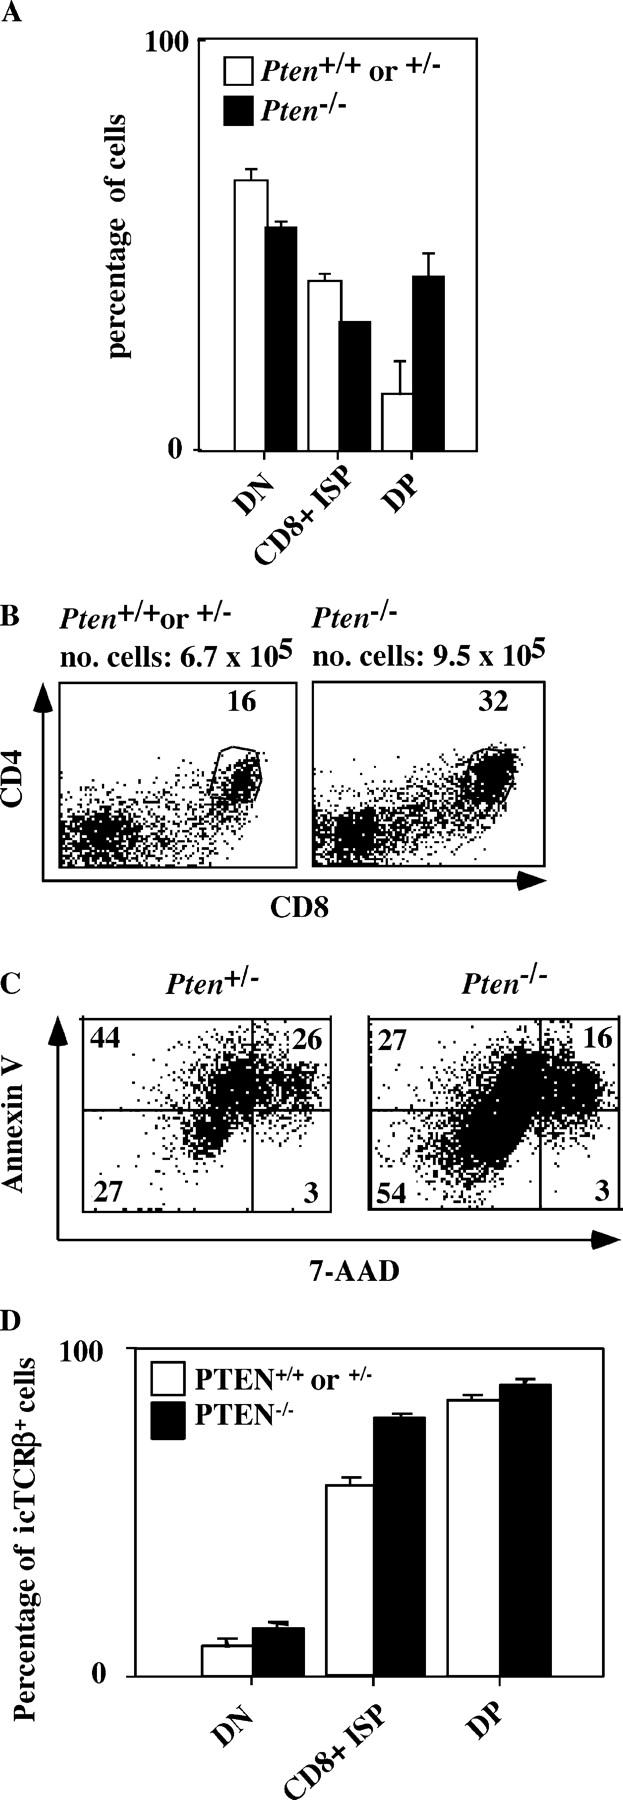
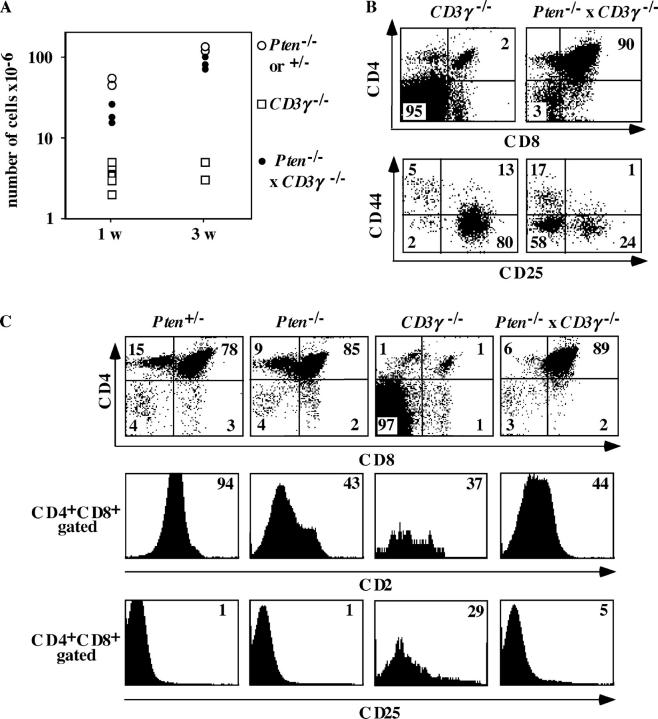
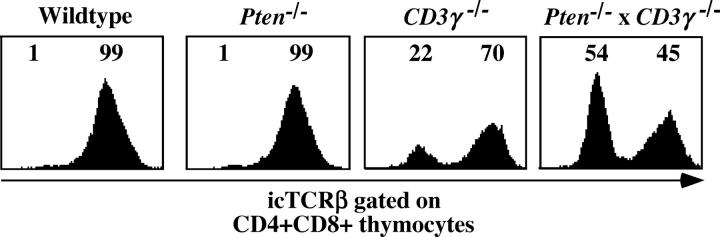
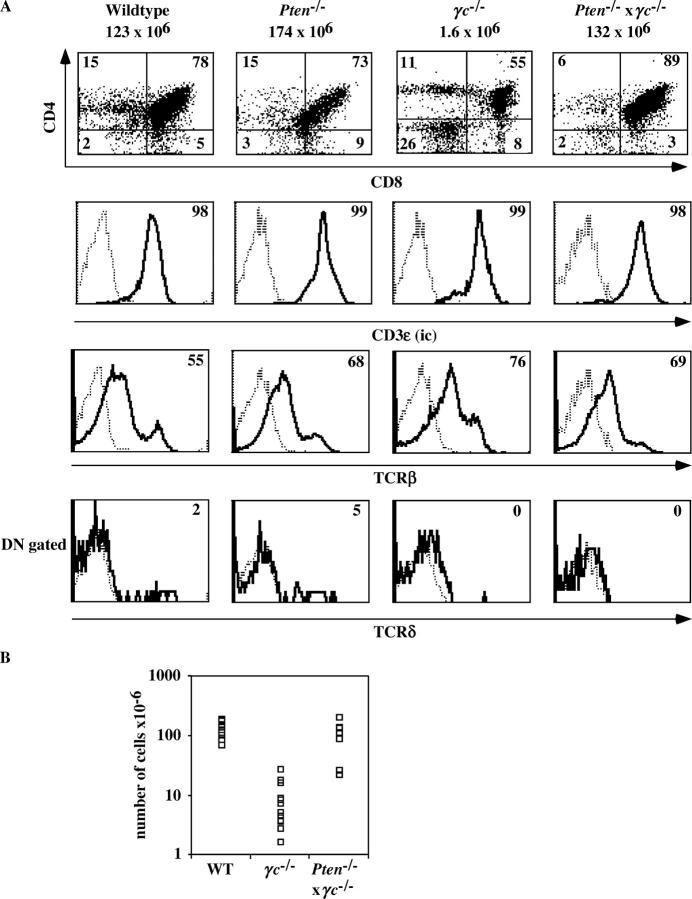
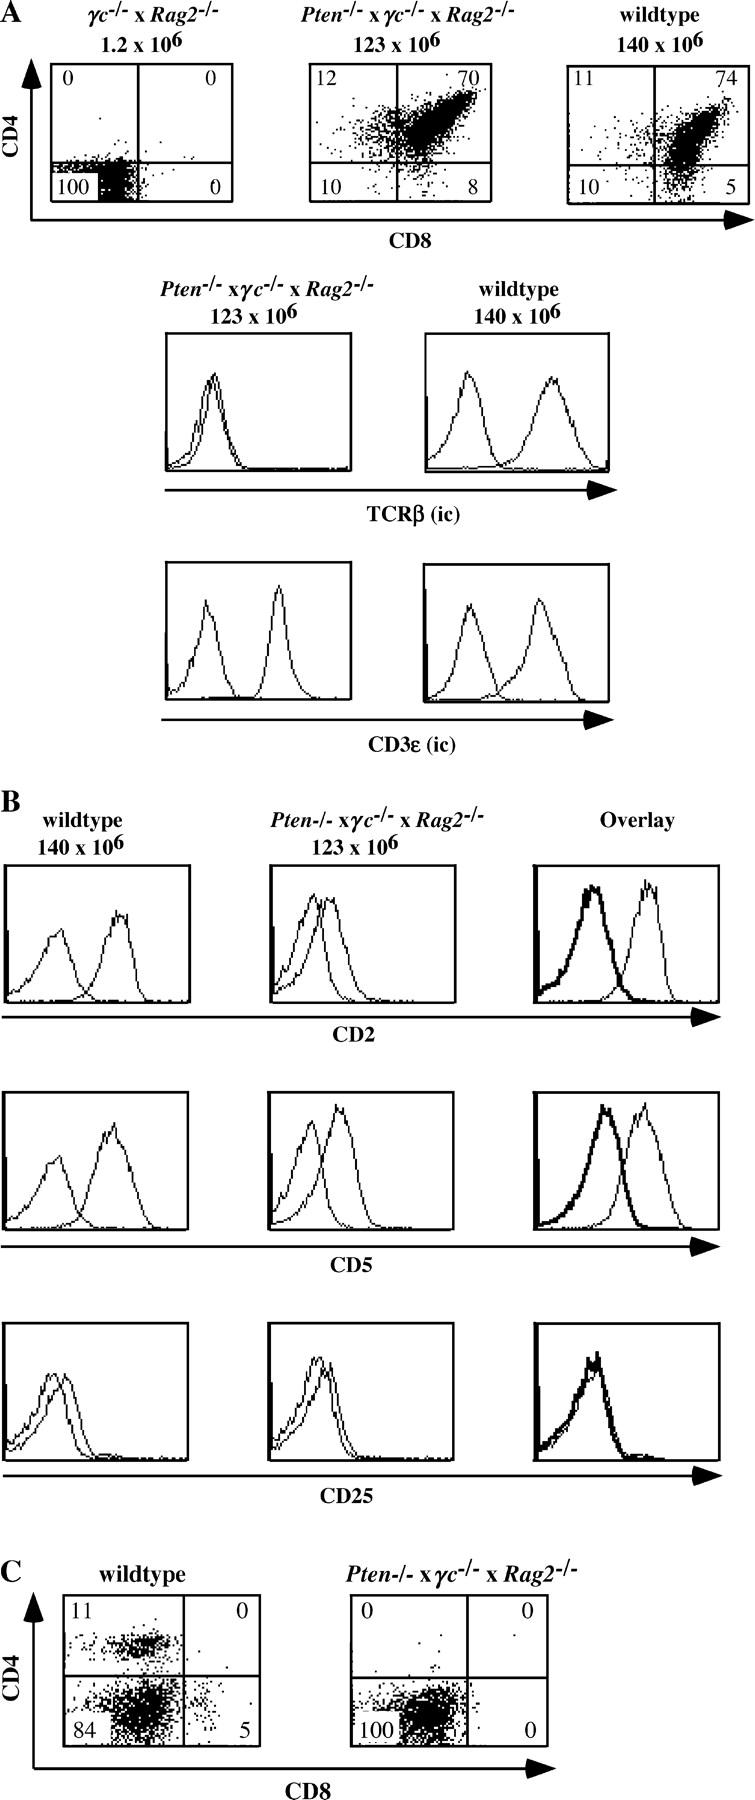
The phosphatase and tensin homologue deleted on chromosome 10 (PTEN) negatively regulates cell survival and proliferation mediated by phosphoinositol 3 kinases. We have explored the role of the phosphoinositol(3,4,5)P3-phosphatase PTEN in T cell development by analyzing mice with a T cell-specific deletion of PTEN. Pten(flox/flox)Lck-Cre mice developed thymic lymphomas, but before the onset of tumors, they showed normal thymic cellularity. To reveal a regulatory role of PTEN in proliferation of developing T cells we have crossed PTEN-deficient mice with mice deficient for interleukin (IL)-7 receptor and pre-T cell receptor (TCR) signaling. Analysis of mice deficient for Pten and CD3gamma; Pten and gammac; or Pten, gammac, and Rag2 revealed that deletion of PTEN can substitute for both IL-7 and pre-TCR signals. These double- and triple-deficient mice all develop normal levels of CD4CD8 double negative and double positive thymocytes. These data indicate that PTEN is an important regulator of proliferation of developing T cells in the thymus.


Figures

Figure 1.
Figure 1.
The absence of PTEN in thymocytes results in constitutive activation of Akt/PKB, and a constitutive phosphorylation of Itk appears only when the mice are developing tumors. (A) PCR analysis of genomic tail DNA derived from 3-wk-old wild-type, heterozygote, and homozygote Pten flox/flox Lck-Cre mice. (B) Western blot analysis of the PTEN protein in the thymus of 4-wk-old homozygote Pten flox/flox Lck-Cre (n = 3) mice, compared with control (wild type, n = 3, and heterozygote, n = 3) mice. Actin staining was performed to confirm equal loading. (C) Western blot analysis of Akt/PKB and phospho-Akt/PKB in the thymus of 5-wk-old (n = 3) or 14-wk-old (n = 2) homozygote Pten flox/flox Lck-Cre mice, compared with control (wild type or heterozygote, n = 3 for each time point) mice. As a control, unstimulated (−) or CD3-stimulated (CD3) Jurkat T cells have been used. Akt/PKB and phospho-Akt/PKB were visualized by Western blotting with the relevant antibodies using 20 × 106 cells per lane (for thymocytes) or 106 cells per lane (for Jurkat T cells). The blots are representative for three separate experiments. (D) Western blot analysis of Itk and phospho-Itk in the thymus of 5-wk-old (n = 3) or 14-wk-old (n = 2) homozygote Pten flox/flox Lck-Cre mice, compared with control (wild type or heterozygote, n = 3 for each time point) mice. As a control, unstimulated (−) or CD3-stimulated (CD3) Jurkat T cells have been used. For immunoprecipitation of Itk with the antibody 2F12, 15 × 107 cells (for thymocytes), or 107 cells (for Jurkat T cells) were used. Phospho-Itk was visualized by Western blotting with the antiphosphotyrosine antibody 4G10. The blots are representative for three separate experiments.
Figure 2.
Figure 2.
The absence of PTEN in thymocytes results in an accelerated generation of DP thymocytes during ontogeny. (A) Percentages of double negative (DN; CD4CD8), immature single positive (ISP; CD8+), and double positive (DP; CD4+CD8+) thymocytes of E16 old homozygote Pten flox/flox Lck-Cre (black bars, n = 3) or control (heterozygote or wild type; white bars, n = 4) embryos as determined by flow cytometry. (B) Flow cytometry of embryonic thymocytes. CD4CD8 staining of E16 old homozygote (Pten flox/flox Lck-Cre) or control (heterozygote or wild type) embryos. Numbers indicate percentages of gated populations. The total cell number mean is indicated for homozygote Pten flox/flox Lck-Cre (n = 3) or control (heterozygote or wild type; n = 4) embryos. (C) Flow cytometry of embryonic thymocytes after 2 d of culture in Iscove's medium supplemented with 8% FCS. 7-AAD and annexin V staining of E16 old homozygote Pten flox/flox Lck-Cre (n = 4) or control (heterozygote; n = 3) embryos. Numbers indicate percentages of gated populations. (D) Percentages of icTCRβ+ DN, ISP, and DP thymocytes of E16 old homozygote Pten flox/flox Lck-Cre (black bars, n = 4) or control (heterozygote; white bars, n = 3) embryos as determined by flow cytometry.
Figure 3.
Figure 3.
The absence of PTEN in thymocytes can rescue the β-selection defect in CD3γ−/− mice. (A) Thymic cellularity of 1- or 3-wk-old Pten flox/flox Lck-Cre × CD3γ−/− mice (n = 6) compared with Pten flox/flox Lck-Cre or Pten +/− (n = 4) and CD3γ−/− (n = 8) mice. (B) Flow cytometry of thymocytes. CD4CD8 and CD44, CD25 staining of 3-wk-old CD3γ−/− (n = 3), or Pten flox/flox Lck-Cre × CD3γ−/− mice (n = 4) mice. Numbers in quadrants indicate percentages of each population. Note that CD25 and CD44 were analyzed after gating on CD4CD8 thymocytes. The gates were set to include 99% of the control, isotype-stained cells of each sample in the negative quadrant. (C) Flow cytometry of thymocytes. CD4CD8 staining of 3-wk-old control (heterozygote; n = 3), Pten flox/flox Lck-Cre (n = 4), CD3γ−/− (n = 4), or Pten flox/flox Lck-Cre × CD3γ−/− (n = 4) mice. Numbers in quadrants indicate percentages of each population. CD2 and CD25 expression are analyzed on CD4+CD8+ thymocytes. Numbers in histogram plots indicate percentages of each positive population.
Figure 4.
Figure 4.
The absence of PTEN in CD3γ−/− thymocytes results in a strong increase of the percentages of CD4+CD8+ icTCRβ cells. Flow cytometry of thymocytes. Intracellular TCRβ staining of 3-wk-old control (wild type; n = 4), Pten flox/flox Lck-Cre (n = 4), CD3γ−/− (n = 4) or Pten flox/flox Lck-Cre × CD3γ−/− (n = 4) mice. Intracellular TCRβ expression is analyzed on CD4+CD8+ DP thymocytes. Numbers in histogram plots indicate percentages of negative and positive populations.
Figure 5.
Figure 5.
The absence of PTEN compensates the thymic defect in γc −/− mice. (A) Flow cytometry of thymocytes for expression of CD4CD8, intracellular CD3ɛ, TCRβ, and TCRδ of 5 wk-old control (wild type), Pten flox/flox Lck-Cre, γc −/−, or Pten flox/flox Lck-Cre × γc −/− mice. Numbers in quadrants indicate percentages of each population. Numbers in histogram plots indicate percentages of each positive population. The total number of thymocytes are indicated on top of the CD4/CD8 dotplots. The gates were set to include 99% of the control isotype-stained cells of each sample in the negative quadrant. (B) Thymic cellularity of 5-wk-old control (wild type or heterozygous; n = 6), γc −/− (n = 17), and Pten flox/flox Lck-Cre × γc −/− mice (n = 10).
Figure 6.
Figure 6.
Loss of PTEN compensates the thymic defect in γc −/− × Rag2 −/− mice. (A) Flow cytometric analysis of expression of CD4CD8, icCD3ɛ, and icTCRβ in thymocytes of 4–5 wk-old control (wild type; n = 11), γc −/− × Rag2 −/− (n = 1), and Pten flox/flox Lck-Cre × γc −/− × Rag2 −/− (n = 3) mice. Numbers in quadrants indicate percentages of each population. The total numbers of thymocytes are indicated on top of the CD4/CD8 dotplots. The gates were set to include 99% of the control, isotype-stained cells of each sample in the negative quadrant. (B) Expression of CD2, CD5 and CD25 in CD4+CD8+ cells of 4–5-wk-old control (wild type; n = 11) and Pten flox/flox Lck-Cre × γc −/− × Rag2 −/− (n = 3) mice. The cells were stained and expression of CD2, CD5 and CD25 were analyzed on CD4+CD8+ DP thymocytes. (C) Expression of CD4 and CD8 on spleen cells of 4–5 wk-old control (wild type; n = 11) and Pten flox/flox Lck-Cre × γc −/− × Rag2 −/− (n = 3) mice. Numbers in quadrants indicate percentages of each population. The gates were set to include 99% of the control, isotype-stained, cells of each sample in the negative quadrant.

Similar articles

Cited by

References

    1. Godfrey, D.I., and A. Zlotnik. 1993. Control points in early T-cell development. Immunol. Today. 14:547–553. - PubMed
    1. Mallick, C.A., E.C. Dudley, J.L. Viney, M.J. Owen, and A.C. Hayday. 1993. Rearrangement and diversity of T cell receptor beta chain genes in thymocytes: a critical role for the beta chain in development. Cell. 73:513–519. - PubMed
    1. von Boehmer, H., I. Aifantis, J. Feinberg, O. Lechner, C. Saint-Ruf, U. Walter, J. Buer, and O. Azogui. 1999. Pleiotropic changes controlled by the pre-T-cell receptor. Curr. Opin. Immunol. 11:135–142. - PubMed
    1. Gomez, M., V. Tybulewicz, and D.A. Cantrell. 2000. Control of pre-T cell proliferation and differentiation by the GTPase Rac-I. Nat. Immunol. 1:348–352. - PubMed
    1. Kim, K., C.K. Lee, T.J. Sayers, K. Muegge, and S.K. Durum. 1998. The trophic action of IL-7 on pro-T cells: inhibition of apoptosis of pro-T1, -T2, and -T3 cells correlates with Bcl-2 and Bax levels and is independent of Fas and p53 pathways. J. Immunol. 160:5735–5741. - PubMed

Publication types

MeSH terms