Comparative Study
. 2004 Oct;124(4):333-48.
doi: 10.1085/jgp.200409145.

New insights on the voltage dependence of the KCa3.1 channel block by internal TBA

Affiliations
Comparative Study

New insights on the voltage dependence of the KCa3.1 channel block by internal TBA

Umberto Banderali et al. J Gen Physiol. 2004 Oct.

Abstract

We present in this work a structural model of the open IKCa (KCa3.1) channel derived by homology modeling from the MthK channel structure, and used this model to compute the transmembrane potential profile along the channel pore. This analysis showed that the selectivity filter and the region extending from the channel inner cavity to the internal medium should respectively account for 81% and 16% of the transmembrane potential difference. We found however that the voltage dependence of the IKCa block by the quaternary ammonium ion TBA applied internally is compatible with an apparent electrical distance delta of 0.49 +/- 0.02 (n = 6) for negative potentials. To reconcile this observation with the electrostatic potential profile predicted for the channel pore, we modeled the IKCa block by TBA assuming that the voltage dependence of the block is governed by both the difference in potential between the channel cavity and the internal medium, and the potential profile along the selectivity filter region through an effect on the filter ion occupancy states. The resulting model predicts that delta should be voltage dependent, being larger at negative than positive potentials. The model also indicates that raising the internal K+ concentration should decrease the value of delta measured at negative potentials independently of the external K+ concentration, whereas raising the external K+ concentration should minimally affect delta for concentrations >50 mM. All these predictions are born out by our current experimental results. Finally, we found that the substitutions V275C and V275A increased the voltage sensitivity of the TBA block, suggesting that TBA could move further into the pore, thus leading to stronger interactions between TBA and the ions in the selectivity filter. Globally, these results support a model whereby the voltage dependence of the TBA block in IKCa is mainly governed by the voltage dependence of the ion occupancy states of the selectivity filter.


Figures
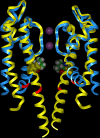
F<sc>igure</sc> 1.
Figure 1.
3D representation of the proposed structure for the open (blue) and closed (yellow) IKCa channel. Only two of the four monomers are presented for clarity. The two structures were superimposed to illustrate the structural changes related to channel opening. The V275 residue, shown in a VDW representation, is colored in yellow for the closed channel and in atom color code for the open channel configuration. The location of the A283 residue is marked in red. According to these models, the V275 residue is lining the central cavity, whereas the A283 residue is located in the channel inner vestibule. The model also includes two ions in the selectivity filter. Models were constructed by homology modeling using the KcsA and MthK bacterial channels as templates (see materials and methods for details). Graphical representation was generated using the InsightII software (Accelrys Inc.).
(SCHEME 1)
(SCHEME 1)
F<sc>igure</sc> 2.
Figure 2.
IKCa block by TBA. (A) Perfusion protocol used to measure TBA block dose–response curves. Inside-out current records were measured in symmetrical 200 mM K2SO4 + 100 μM EBIO conditions at a constant membrane potential of −60 mV. Increasing concentrations of internal TBA were applied for short periods (2 s) separated by 2 s of washout. The percentage of inhibition was calculated with 100% corresponding to the current level before each TBA application, and 0% the current recorded in zero Ca2+ conditions. The magnification shows the exponential time course of the current recovery (τon) after TBA removal. (B) Dose–response curve of IKCa block by TBA. The continuous line was computed from Eq. 1 with IC50 = 192 μM.
F<sc>igure</sc> 3.
Figure 3.
TBA prevents V275C mutant from reacting with MTSET. (A) Perfusion protocol used to test the effectiveness of TBA to protect Cys residues engineered either at position 275 or 283 from being covalently modified by MTSET. Inside-out current records measured in symmetrical 200 mM K2SO4 + 100 μM EBIO conditions at a constant membrane potential of −60 mV. The perfusion protocol consisted in applying MTSET (5 mM) for 1 s during each 2-s internal application of TBA at 5 mM. Recovery from channel block was measured within the 2-s washout periods separating successive TBA applications. As a result, MTSET was applied for 1 s for each perfusion cycle of 4 s. (B) In the absence of TBA, internal applications of MTSET resulted in a gradual decrease of the V275C currents with a time constant of 18.6 ± 0.9 s (circles; n = 2). The inhibitory effect of MTSET was considerably impaired in the presence of internal TBA (5 mM) with a time constant of inhibition estimated at 147 ± 2 s (squares; n = 4). These results indicate that the TBA interaction site should be located close enough to the cavity lining 275C residue as to reduce its accessibility to MTSET. (C) Similar site protection experiments were performed with the A283C mutant. Internal application of MTSET (5 mM) caused in this case a large increase of the A283C-induced currents. The current activation recorded either with (squares) or without (circles) internal TBA showed no significant differences in time constant, with values of 1.23 ± 0.18 s (n = 2) and 0.92 ± 0.08 s (n = 2), respectively. These results argue for a TBA binding site located in close proximity of the cavity lining V275 residue, distant from A283.
F<sc>igure</sc> 4.
Figure 4.
Effect of EBIO on the IKCa channel open probability and TBA sensitivity. (A) Inside-out recording of IKCa channel showing the effect of the internal addition of 100 μM EBIO. Experiments performed in symmetrical 200 mM K2SO4 + 25 μM internal Ca2+ conditions at a constant membrane potential of −60 mV. As seen, EBIO elicited a clear increase in the current mean value and variance. EBIO did not modify, however, the single channel current amplitude (not depicted). (B) TBA block dose–response curves with (filled squares) and without (open squares) 100 μM EBIO added to the internal solution. The addition of EBIO decreased the apparent IC50 value from 298 ± 20 μM (n = 11) to 192 ± 7 μM (n = 12) (P < 0.0001). (C) Variation of the ratio σ2/<I> (Eq. 10) as a function of voltage for the wild-type IKCa channel with (filled squares) and without EBIO (open squares). The channel open probability was computed according to Eq. 11 using as reference the IKCa channel I/V curve obtained from single channel recordings (dots). The continuous line represents the prediction of the model in Fig. 6 A with: k1(0) = 0.75 × 10⁹ s−1, k2(0) = 2.5 × 10⁹ s−1, k1B(0) = k3(0) = 0.165 × 10⁹ s−1, k2B(0) = k4(0) = 11.5 × 10⁹ s−1, ki(0) = 1.8 × 10¹⁰ M−1s−1, ke(0) = 1.26 × 10⁹ s−1, ko(0) = 6.5 × 10⁸ M−1s−1, kx(0) = 3.0 × 10⁷ s−1, k5(0) = 1.25 × 10⁹ s−1, k6(0) = 2.7 × 10⁹ s−1, α = β = 0.84, f = 0.22. (D) Effect of EBIO on the IKCa open probability Po as measured by noise analysis according to Eq. 11. EBIO increased Po from 0.17 ± 0.08 (n = 6) to 0.50 ± 0.09 (n = 6).
F<sc>igure</sc> 5.
Figure 5.
Voltage dependence of the TBA-induced IKCa channel block. (A) Dose–response curves of IKCa block by TBA measured in EBIO (100 μM) conditions at membrane potentials ranging from −120 to −30 mV. The concentration for half inhibition IC50 was computed by fitting the experimental data to Eq. 1. Increasing hyperpolarizing voltages rightward shifted the dose–response curves with IC50 values of 666 ± 17 μM (n = 6) and 113 ± 4 μM (n = 6) at −120 and −30 mV, respectively. (B) Plot of IC50 as a function of voltage measured in the presence (filled squares) and in the absence (open squares) of EBIO. Data points within the voltage range −120 to −30 mV were fitted to a single exponential function resulting in an electrical distance of 0.49 ± 0.02 (n = 6). The continuous lines were computed from the model presented in Fig. 6 A using Eqs. 13 and 14 with IC50 = <KB4>/<KB3>. The best fit was obtained with KB41(0) = 8 s−1, KB42(0) = 28 s−1, KB43(0) = 1.7 s−1, KB31(0) = 0.022 s−1μM−1, KB32(0) = 0.07 s−1μM−1, KB33(0) = 0.1 s−1μM−1 with EBIO and KB41(0) = 2.9 s−1, KB42(0) = 10.4 s−1, KB43(0) = 0.63 s−1, KB31(0) = 0.006 s−1μM−1, KB32(0) = 0.02 s−1μM−1, KB33(0) = 0.026 s−1μM−1 without EBIO. (C) Plot of apparent TBA exit rate ζPoK4 as a function of voltage measured either in the presence (filled squares) or in the absence (open squares) of EBIO. EBIO elicited an average 2.7-fold increase of the TBA exit rates. For voltages ranging from −150 to −30 mV, the apparent exit rate ζPoK4 decreased an e-fold factor per 90 mV for a voltage dependence with an electrical distance of 0.26 ± 0.02. The continuous lines represent the prediction of the model of Fig. 6 A computed according to Eq. 14 with KB41(0), KB42(0), and KB43(0) as in B. (D) Plot of the apparent TBA entry rate PoK3 as a function of voltage measured either in the presence (filled squares) or in the absence (open squares) of EBIO. Filled (EBIO) and open (no EBIO) diamonds show TBA entry rates K3 after correcting for the channel open probabilities Po. The resulting K3 values are shown to be comparable under both experimental conditions with a voltage dependence corresponding to an e-fold increase per 150 mV. The continuous lines represent the prediction of the model of Fig. 6 A, computed according to Eq. 13 with KB31(0), KB32(0), and KB33(0) as in B.
F<sc>igure</sc> 6.
Figure 6.
Proposed mechanism for the IKCa block by internal TBA. (A) The channel pore region is pictured as six distinct binding sites for K+ ions, with S1 to S4 the binding sites for K+ ions in the selectivity filter and S5 and S0 the channel central cavity and external K+ ion binding site, respectively. In this model, TBA blocks the pore by entering the open channel from the cytoplasmic side up to the inner cavity (S5), where it binds without going through the selectivity filter. In the unblocked mode, K+ ion (filled dot) flux is described as a sequence of changes in the ion occupancy configuration of the pore. K+ ion efflux will be obtained following any of the paths starting with the entrance of an ion into S5 and leading to the hopping of an ion out of S0 to the external medium. Reversibly, any of the paths starting with an ion entering S0 and ending with the release on an ion from S5 into the inner medium will account for K+ influx. A parameter f, with f < 1, is introduced to account for the effect of the occupancy state of S4 on the entry and exit rates of K+ to and from the cavity (S5) so that ki and ke/f become higher than ki*f and ke, respectively. Formally, f corresponds to exp(−(E[S4,S2,z] − E[S3,S1,z])/2KT) where E[S4,S2,z] and E[S3,S1,z] correspond to the electrostatic energies of TBA along the pore axis for the [S4,S2] and [S3,S1] selectivity filter configurations, respectively. For z = 0, the energy profile in C predicts f = 0.22. Identical sequences for the occupation states are hypothesized for the pore in the blocked configuration. The mean entry and exit rates of TBA to/from S5 (<KB3> and <KB4>) will strictly depend on the ion occupancy state of the rest of the pore (see Eqs. 13 and 14). The voltage dependence of the rate constants was derived from the potential profile presented in B so that k1 = k1(0)exp(−0.23Vq/KT), k2 = k2(0)exp(0.23Vq/KT), k3 = k3(0)exp(−0.23Vq/KT), k4 = k4(0)exp(0.23Vq/KT), k5 = k5(0)exp((α/2 − 0.23)Vq/KT), k6 = k6(0)exp(−(α/2 − 0.23)Vq/KT), ki = ki(0)exp(0.5 (1 − α)Vq/KT), ke = ke(0)exp(−0.5(1 − α)Vq/KT), kB1 = kB1(0)exp(−0.23Vq/KT), and kB2 = kB2(0)exp(0.23Vq/KT), with α referring to the fraction of potential V applied between S5 (cavity region) and the external solution. The external binding site S0 and the external medium being equipotential (B), the rate constants ko and kx were considered voltage insensitive. It was assumed finally that the voltage dependence in each transition was partitioned evenly between forward and backward rates. (B) Transmembrane potential profile computed by solving the Poisson-Boltzmann equation for the pore region of the wild-type IKCa, V275C, V275A, and V275L channels. The IKCa 3D structure was obtained by homology modeling using the MthK channel coordinates as template. These calculations indicated that 81% of the applied voltage is restricted to the selectivity filter region. The difference in potential between the cavity and the cytoplasmic medium accounts for <16% of the transmembrane potential. (C) Free energy profile for transferring an ion from the bulk medium to a point z (x = y = 0) along the channel central axis, computed for the IKCa wild-type and V275C channels (identical results were obtained for the V275A and V275L mutants). Calculations were performed in conditions where the selectivity filter was either in the [S4,S2] or [S3,S1] configuration. The coordinate z = 0 corresponds to the expected position of the V275 residue. The model predicts a maximum difference in energy of 1.8 kcal M−1 at z = 0 for both channels.
F<sc>igure</sc> 7.
Figure 7.
Effect of external and internal K+ ion activity on TBA block. In A, the probabilities of the [S3,S1], [S4,S2], or [S4,S2,S0] channel states are plotted as a function of membrane voltage. At hyperpolarizing potentials, the [S4,S2] state is favored and its probability decreases monotonically with depolarization. In contrast, the probability of the [S4,S2,S0] state increases monotonically from close to zero at negative potentials to a maximum probability of 0.65 with depolarization. Finally, the probability of the [S3,S1] state showed little variations within the voltage range −100 to 0 mV. (B) Effect of changing the extracellular K+ ion activity (αKo) on the voltage dependence of IKCa block. Experiments were performed on IKCa wild-type channel with αKo = 60 mM (solution 50 K2SO4, open triangles), 140 mM (solution 200 K2SO4, filled squares), or 225 mM (solution 400 K2SO4, open circles) respectively, keeping the intracellular K+ activity constant αKi at 140 mM (solution 200 K2SO4). Decreasing αKo resulted in a decrease in IC50 over the entire voltage range. Also, increasing αKo led to an increase in the apparent electrical distance δ computed within the voltage range −150 to −30 mV, with δ values of 0.44 ± 0.01 (n = 4), 0.49 ± 0.01 (n = 4), and 0.52 ± 0.03 (n = 4) for αKo = 60, 140, and 225 mM, respectively. Theoretical curves (continuous lines) were generated using the rate constant values given in Fig. 5 B. These results indicate that the occupancy of S5 depends on the external potassium activity, which is consistent with the model in Fig. 6 A. (C) Effect of αKi on the voltage dependence of IKCa block. Experiments were performed with αKi = 140 mM (solution 200 K2SO4, squares) or 2 mM (solution 1 K2SO4, circles), keeping αKo constant at 140 mM (solution 200 K2SO4). Decreasing αKi resulted in a decrease of IC50 over the entire voltage range and led to an increase of the apparent electrical distance δ computed at negative potentials, with δ = 0.54 ± 0.01 (n = 3) in 2 mM internal K+ conditions and 0.49 ± 0.02 (n = 6) in symmetrical 140 mM/140 mM K+. These results are consistent with a competition between potassium and TBA for the site in S5, as proposed in Fig. 6 A. Theoretical curves (continuous lines) were generated using the rate constant values given in Fig. 5 B.
F<sc>igure</sc> 8.
Figure 8.
(A) 3D plot illustrating the effects of intracellular (αKi) and extracellular (αKo) K+ ion activity on the apparent electrical distance δ, computed by curve fitting to a single exponential function the expected variations in IC50 as a function of voltage predicted from the model in Fig. 6 A, for voltages ranging from −150 to −30 mV. As observed experimentally, increasing αKi at constant αKo causes a systematic reduction in δ. In 140 mM αKo for instance, the model predicts an apparent electrical distance δ of 0.56 for αKi = 2 mM, which is in accordance with the electrical distance observed experimentally. The model also predicts an increase in δ at increasing αKo for αKo < 50 mM, with δ remaining close to 0.47 at higher αKo values. (B) 3D plot of the apparent electrical distance δ as a function of αKo and αKi computed over the voltage range 0–90 mV, with δ computed as described in A. Clearly the electrical distances δ computed at positive potentials (0–90 mV) are smaller than the values estimated at negative potentials under identical internal/external potassium conditions. These results point to an electrical distance for TBA block whose value depends on the potential range used to estimate the voltage dependence of the TBA block. Finally, increasing αKi is seen to result in an increase and not a decrease in δ value as shown in A.
F<sc>igure</sc> 9.
Figure 9.
Effect of V275 mutations on the properties of the TBA-dependent block. (A) Inside-out current traces showing dose-dependent block of V275A, V275C, and V275L mutants by internal TBA. Experiments were performed in symmetrical 200 mM K2SO4 + 25 μM internal Ca2+ and 100 μM EBIO conditions at a constant membrane potential of −60 mV. (B) TBA inhibition dose–response curves for the IKCa wild type and V275A, V275C, and V275L mutants. Data points were fitted to Eq. 1 and yielded IC50 = 192 ± 7 μM for wild type (n = 12), 262 ± 29 μM for V275A (n = 5), 18.0 ± 1.7 μM for V275C (n = 4), and 607 ± 54 μM for V275L (n = 3). (C) Effect of mutating the V275 residue on the apparent electrical distance of the TBA blocking site δ measured in the voltage range between −150 and −30 mV. The TBA-dependent block IC50 is plotted as a function of membrane voltage for wild-type IKCa and V275A, V275C, and V275L mutants. Mutations V275A and V275C led to δ = 0.7 compared with δ = 0.49 for the wild-type and V275L channels. These data indicate that the smaller residues engineered at position 275 are correlated to higher values of the apparent electrical distance of the TBA blocking site in the channel.
F<sc>igure</sc> 10.
Figure 10.
(A) Expected variation of the electrical distance for TBA block at negative potentials. Calculations based on the transmembrane and electrostatic energy profiles illustrated in Fig. 6 (B and C). The equilibrium constant kB1(0)/kB2(0) was computed as (k1(0)/k2(0))f2, with f2 = exp(−(E[S4,S2,z] − E[S3,S1,z])/KT), where E[S4,S2,z] and E[S3,S1,z] correspond to the electrostatic energies of a charged particle along the pore axis for the [S4,S2] and [S3,S1] selectivity filter configurations, respectively. The effect of the electrostatic interactions on the TBA entry and exit rates was taken into account using KB43(0)/KB41(0) = f; KB42(0)/KB41(0) = KB40f; KB31(0)/KB33(0) = f, and KB32(0)/KB33(0) = KB30f, with KB30 and KB40 estimated from the curve fitting parameters obtained for TBA block assuming TBA located at z = 0 (α = 0.84). (B) Expected electrical distance between the TBA binding site and the internal medium. (1 − β).

Similar articles

Cited by

References

    1. Berneche, S., and B. Roux. 2003. A microscopic view of ion conduction through the K+ channel. Proc. Natl. Acad. Sci. USA. 100:8644–8648. - PMC - PubMed
    1. Choi, K.L., C. Mossman, J. Aube, and G. Yellen. 1993. The internal quaternary ammonium receptor site of Shaker potassium channels. Neuron. 10:533–541. - PubMed
    1. Ding, S., and R. Horn. 2002. Tail end of the s6 segment: role in permeation in shaker potassium channels. J. Gen. Physiol. 120:87–97. - PMC - PubMed
    1. Doyle, D.A., J.M. Cabral, R.A. Pfuetzner, A. Kuo, J.M. Gulbis, S.L. Cohen, B.T. Chait, and R. MacKinnon. 1998. The structure of the potassium channel: molecular basis of K+ conduction and selectivity. Science. 280:69–77. - PubMed
    1. French, R.J., and J.J. Shoukimas. 1981. Blockage of squid axon potassium conductance by internal tetra-N-alkylammonium ions of various sizes. Biophys. J. 34:271–291. - PMC - PubMed

Publication types

MeSH terms

Substances