. 2004 Oct;124(4):383-94.
doi: 10.1085/jgp.200308973.

Identification of the Ca2+ blocking site of acid-sensing ion channel (ASIC) 1: implications for channel gating

Affiliations

Identification of the Ca2+ blocking site of acid-sensing ion channel (ASIC) 1: implications for channel gating

Martin Paukert et al. J Gen Physiol. 2004 Oct.

Abstract

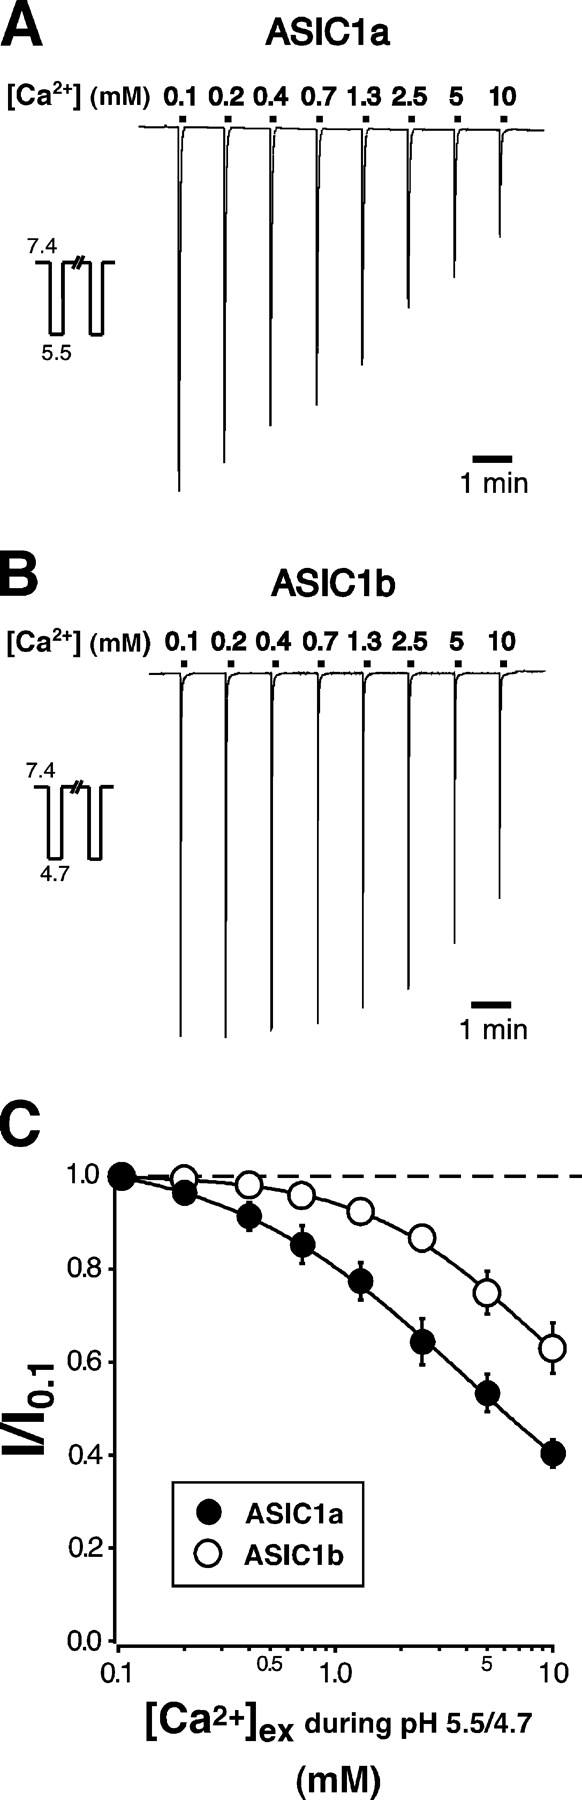
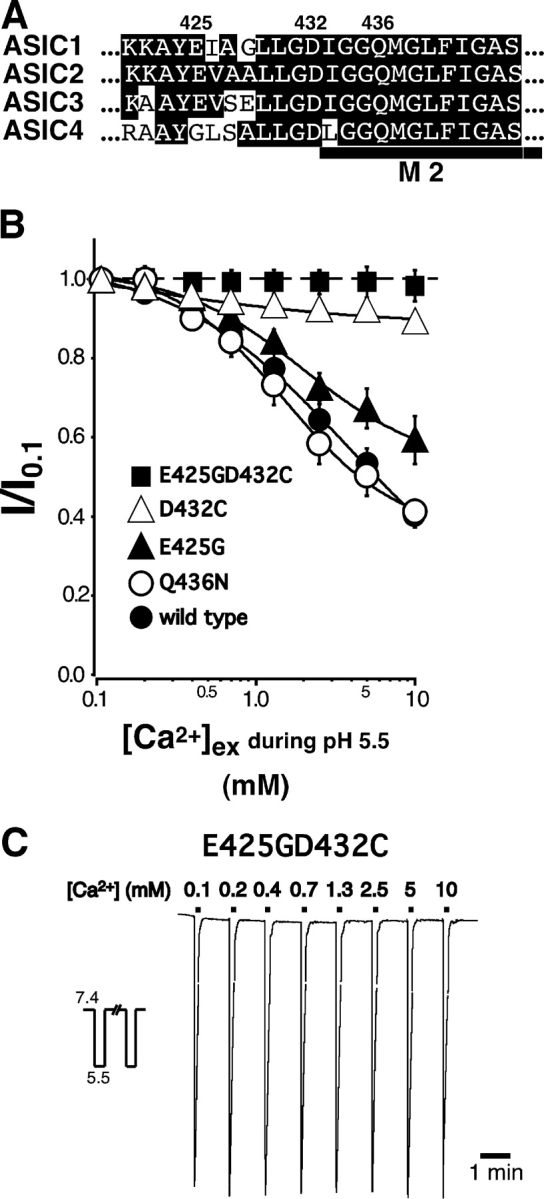
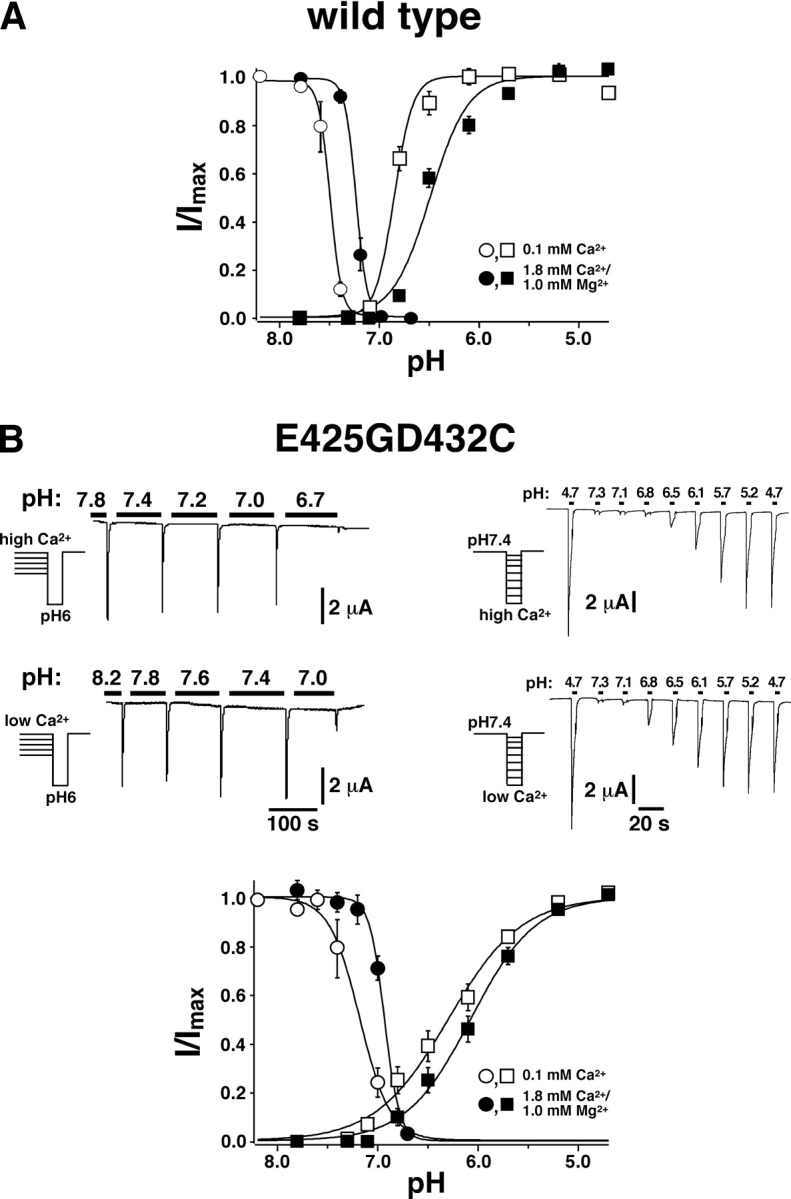
Acid-sensing ion channels ASIC1a and ASIC1b are ligand-gated ion channels that are activated by H+ in the physiological range of pH. The apparent affinity for H+ of ASIC1a and 1b is modulated by extracellular Ca2+ through a competition between Ca2+ and H+. Here we show that, in addition to modulating the apparent H+ affinity, Ca2+ blocks ASIC1a in the open state (IC50 approximately 3.9 mM at pH 5.5), whereas ASIC1b is blocked with reduced affinity (IC50 > 10 mM at pH 4.7). Moreover, we report the identification of the site that mediates this open channel block by Ca2+. ASICs have two transmembrane domains. The second transmembrane domain M2 has been shown to form the ion pore of the related epithelial Na+ channel. Conserved topology and high homology in M2 suggests that M2 forms the ion pore also of ASICs. Combined substitution of an aspartate and a glutamate residue at the beginning of M2 completely abolished block by Ca2+ of ASIC1a, showing that these two amino acids (E425 and D432) are crucial for Ca2+ block. It has previously been suggested that relief of Ca2+ block opens ASIC3 channels. However, substitutions of E425 or D432 individually or in combination did not open channels constitutively and did not abolish gating by H+ and modulation of H+ affinity by Ca2+. These results show that channel block by Ca2+ and H+ gating are not intrinsically linked.


Figures

F<sc>igure</sc> 1.
Figure 1.
Block by Ca2+ of ASIC1 expressed in Xenopus oocytes. (A) Block by Ca2+ of ASIC1a. Representative trace of ASIC1a currents elicited by application of pH 5.5 and varying concentrations of extracellular Ca2+. The trace was obtained from two original traces, one measured with increasing and one with decreasing Ca2+ concentrations. Both traces were normalized and then averaged to yield the trace shown. Acidic application solution was applied for 10 s and contained 140 mM NaCl and the indicated concentration of CaCl2. Neutral bath solution was applied for 1 min between channel activation and always contained 140 mM NaCl and 1.8 mM CaCl2. (B) Block by Ca2+ of ASIC1b. Representative trace of ASIC1b currents elicited by application of pH 4.7 and varying concentrations of extracellular Ca2+. The trace was obtained by averaging two traces as described in A. Duration of solution application and concentration of NaCl and CaCl2 as in A. (C) Dose–response relationship for inhibition by Ca2+. Lines represent a fit of the data to Eq. 1; the dotted line represents the maximal current, I = 1. IC50 was 3.92 ± 1.02 mM (n = 16) for ASIC1a and >10 mM (n = 8) for ASIC1b. Hill coefficient was 1.25 ± 0.16 and 3.48 ± 2.58, respectively. Note that block of ASIC1a is not complete with 10 mM Ca2+. Peak current amplitudes with 0.1 mM Ca2+ were 12.1 ± 1.6 μA for ASIC1a and 17.6 ± 4.4 μA for ASIC1b.
F<sc>igure</sc> 2.
Figure 2.
Apparent single channel amplitude of ASIC1a depends on extracellular Ca2+. (Top) Single channel current amplitude of ASIC1a with 1.8 mM Ca2+. Left, representative segment of an outside-out patch-clamp recording. The extracellular test solution contained 140 mM NaCl and 1.8 mM CaCl2; pH was 7.05. Right, amplitude histogram representing the respective pool of segments of recordings as shown on the left; 299 individual events contributed to the histogram. Amplitude distribution was fitted to a sum of Gaussian functions. Single channel current amplitude was −1.3 ± 0.4 pA (mean ± σ; n = 4 individual patches). Holding potential was −100 mV. (Bottom) Single channel current amplitude of ASIC1a with 0.1 mM Ca2+. Left, representative segment of an outside-out patch-clamp recording. Right, amplitude histogram; 165 individual events of level 1 (corresponding to one open channel) contributed to the histogram. Single channel current amplitude was −4.9 ± 0.9 pA (n = 3 individual patches). Holding potential was −100 mV.
F<sc>igure</sc> 3.
Figure 3.
Voltage dependence of Ca2+ block in ASIC1. (A) Voltage dependence of Ca2+ block of ASIC1a. Current measured with 1 mM, 1.8 mM, or 10 mM Ca2+ was normalized to the current measured with 0 mM Ca2+ (IxCa/I0Ca) at a given holding potential (n = 8). (B) Voltage dependence of Ca2+ block in ASIC1b. Current measured with 10 mM Ca2+ was normalized to the current measured with 0 Ca2+. Fit of the data from 0 mV to 100 mV to a Boltzmann function is represented by the line and gave a δ value of 0.054 ± 0.007 (n = 9).
F<sc>igure</sc> 4.
Figure 4.
Combined mutation of glutamate 425 and aspartate 432 of ASIC1a abolishes Ca2+ block. (A) Amino acid sequences of the predicted second transmembrane domain M2 of ASICs in the one-letter code. Amino acids in M2 are identical between ASIC1a and ASIC1b. The position of M2 is indicated by the bar. (B) Dose–response curves for Ca2+ block of ASIC1a channels containing the E425G, the D432C, the Q436N, or the E425GD432C substitution. Recordings were obtained using the same protocol as described for Fig. 1. Current that was blocked by 10 mM Ca2+ was 59 ± 3% (n = 12) for Q436N, 41 ± 6% (n = 12) for E425G, 11 ± 2% (n = 14) for D432C, and 2 ± 4% (n = 14–16) for E425GD432C. Lines represent a fit to a logistic function (Eq. 1) of the mean data for individual Ca2+ concentrations. Dose–response curve for Ca2+ block of ASIC1a wild type from Fig. 1 is shown for comparison. Peak current amplitudes with 0.1 mM Ca2+ were 17.9 ± 3.1 μA for Q436N, 6.5 ± 1.0 μA for E425G, 5.8 ± 0.5 μA for D432C, and 7.7 ± 1.0 μA for E425GD432C. (C) Representative trace of ASIC1aE425GD432C currents elicited by application of pH 5.5 and varying concentrations of extracellular Ca2+. The trace was obtained by averaging two original traces as described for Fig. 1 A. Duration of solution application and concentration of NaCl and CaCl2 as in Fig. 1 A.
F<sc>igure</sc> 5.
Figure 5.
Apparent affinity for amiloride of ASIC1a wild type but not of ASIC1a E425GD432C depends on Ca2+. (A) Dose–response relationship for inhibition of ASIC1a by amiloride in the presence of 0.1 mM Ca2+ (○) or 10 mM Ca2+ (•). Lines represent a fit of the data to Eq. 1. IC50 was 11.6 ± 2.4 μM (n = 15) in the presence of 0.1 mM Ca2+ and 33.3 ± 10.0 μM (n = 15) in the presence of 10 mM Ca2+; P < 0.05. Peak current amplitudes without amiloride were 14.8 ± 1.3 μA with 0.1 mM Ca2+ and 10.5 ± 1.7 μA with 10 mM Ca2+. Holding potential was −70 mV. (B) Dose–response relationship for inhibition of ASIC1a E425GD432C by amiloride in the presence of 0.1 mM Ca2+ (□) or 10 mM Ca2+ (▪). IC50 was 17.2 ± 3.7 μM (n = 14) in the presence of 0.1 mM Ca2+ and 18.4 ± 3.9 μM (n = 14) in the presence of 10 mM Ca2+; P = 0.99. Peak current amplitudes without amiloride were 8.1 ± 1.1 μA with 0.1 mM Ca2+ and 9.2 ± 1.5 μA with 10 mM Ca2+. Holding potential was −70 mV.
F<sc>igure</sc> 6.
Figure 6.
Channels containing the double substitution E425GD432C still show Ca2+-dependent shifts of steady-state inactivation and pH activation curves. (A) Dose–response curves for steady-state inactivation by H+ and for activation by H+ with different Ca2+ concentrations for ASIC1a wild type. The curve for steady-state inactivation was published previously (Babini et al., 2002). For steady-state inactivation curves, oocytes were preincubated for 2 min at a conditioning pH varying between 8.2 and 6.7. After this preincubation, available channels were activated by switching to a solution of pH 6.0 containing 140 mM NaCl, 1.8 mM CaCl2/1.0 mM MgCl2. The preincubation solution contained 140 mM NaCl and either 1.8 mM CaCl2/1.0 mM MgCl2 (•) or 0.1 mM CaCl2 (○). The preincubation solution with 0.1 mM CaCl2 also contained 0.1 mM niflumic acid to block the large conductance induced in oocytes by divalent-free extracellular solutions. For H+ activation curves, the preincubation solution contained 140 mM NaCl, 1.8 mM CaCl2/1.0 mM MgCl2; pH 7.8. Every 30 s, a test solution with a pH ranging from 7.4 to 4.7 was applied for 3 s. The test solution contained 140 mM NaCl and either 1.8 mM CaCl2/1.0 mM MgCl2 (▪) or 0.1 mM CaCl2 (□). (B) Top left, representative traces of ASIC1aE425GD432C currents showing steady-state inactivation at two different Ca2+ concentrations. Top right, representative traces of ASIC1aE425GD432C currents showing activation by H+ at two different Ca2+ concentrations. pH was as indicated. Duration of solution application and concentration of NaCl and CaCl2 were as described in A. Bottom, dose–response curves for steady-state inactivation and activation with different Ca2+ concentrations for ASIC1aE425GD432C.
F<sc>igure</sc> 7.
Figure 7.
Removal of extracellular Ca2+ opens ASIC1aE425GD432C. ASIC1a channels were first activated by pH 4.7. 60 s after recovery in pH 8.0, a solution containing no Ca2+ and no Mg2+, but 10 mM EDTA was applied; the concentration of Ca2+ in this solution should be in the low picomolar range. As can be seen from the blow-up, this divalent-free solution induced a small amiloride-sensitive current in ASIC1a wild type–expressing oocytes (left) as well as in E425GD432C-expressing oocytes (right). A similar response was seen in six independent oocytes for each condition. Solutions contained 0.2 mM flufenamic acid to block the large conductance induced in oocytes by divalent-free extracellular solutions.

Similar articles

Cited by

References

    1. Akopian, A.N., C.C. Chen, Y. Ding, P. Cesare, and J.N. Wood. 2000. A new member of the acid-sensing ion channel family. Neuroreport. 11:2217–2222. - PubMed
    1. Alvarez de la Rosa, D., C.M. Canessa, G.K. Fyfe, and P. Zhang. 2000. Structure and regulation of amiloride-sensitive sodium channels. Annu. Rev. Physiol. 62:573–594. - PubMed
    1. Babini, E., M. Paukert, H.S. Geisler, and S. Gründer. 2002. Alternative splicing and interaction with di- and polyvalent cations control the dynamic range of acid-sensing ion channel 1 (ASIC1). J. Biol. Chem. 277:41597–41603. - PubMed
    1. Bässler, E.L., T.J. Ngo-Anh, H.S. Geisler, J.P. Ruppersberg, and S. Gründer. 2001. Molecular and functional characterization of acid-sensing ion channel (ASIC) 1b. J. Biol. Chem. 276:33782–33787. - PubMed
    1. Baud, C., R.T. Kado, and K. Marcher. 1982. Sodium channels induced by depolarization of the Xenopus laevis oocyte. Proc. Natl. Acad. Sci. USA. 79:3188–3192. - PMC - PubMed

Publication types

MeSH terms