. 2004 Oct;124(4):395-407.
doi: 10.1085/jgp.200409120.

Mechanisms of regulation of epithelial sodium channel by SGK1 in A6 cells

Affiliations

Mechanisms of regulation of epithelial sodium channel by SGK1 in A6 cells

Diego Alvarez de la Rosa et al. J Gen Physiol. 2004 Oct.

Abstract

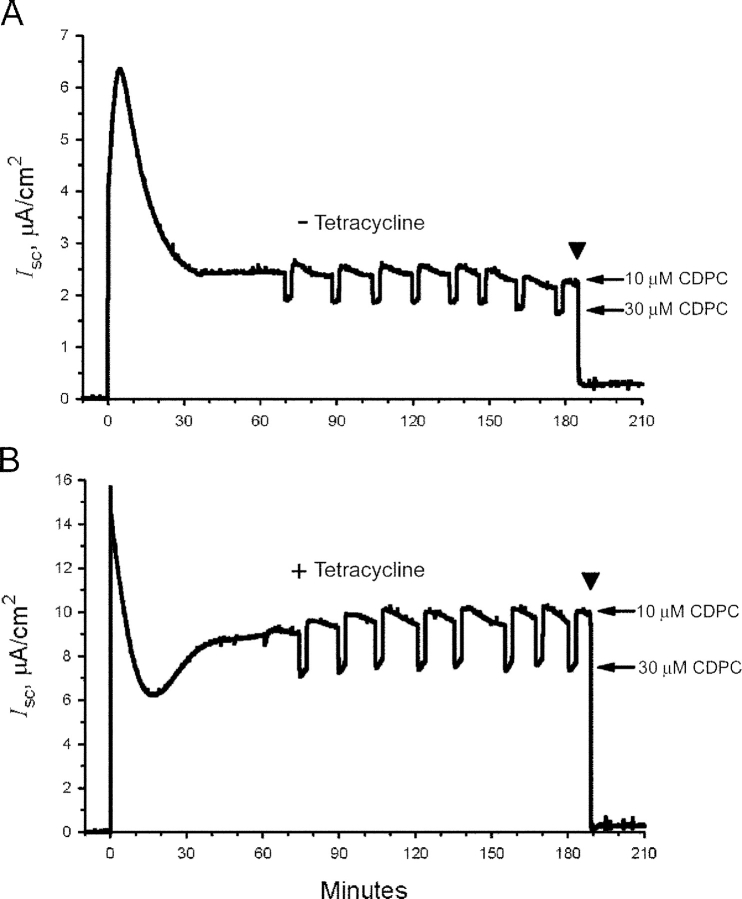
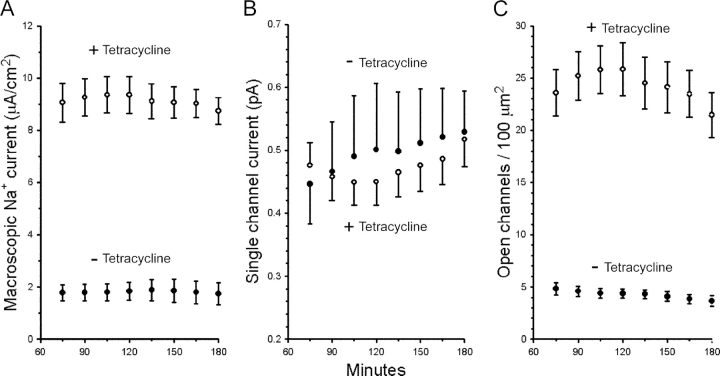
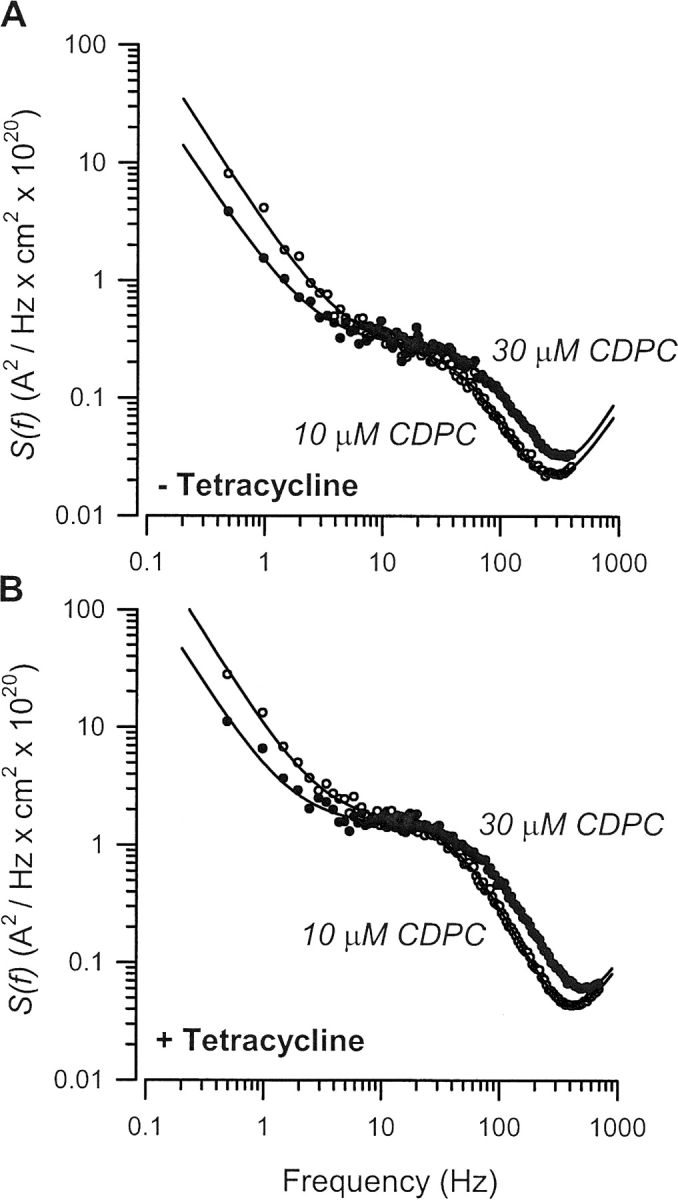
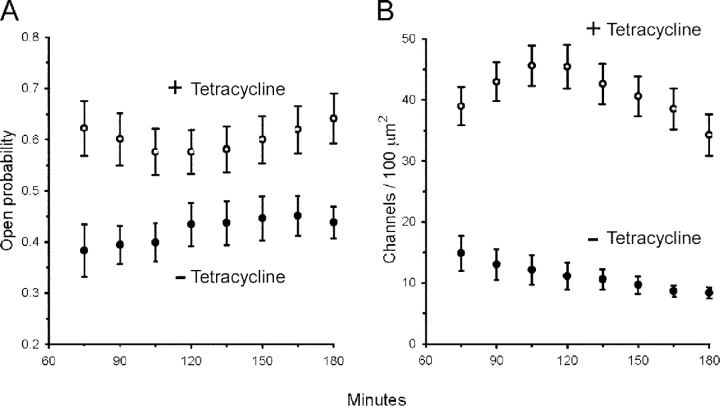
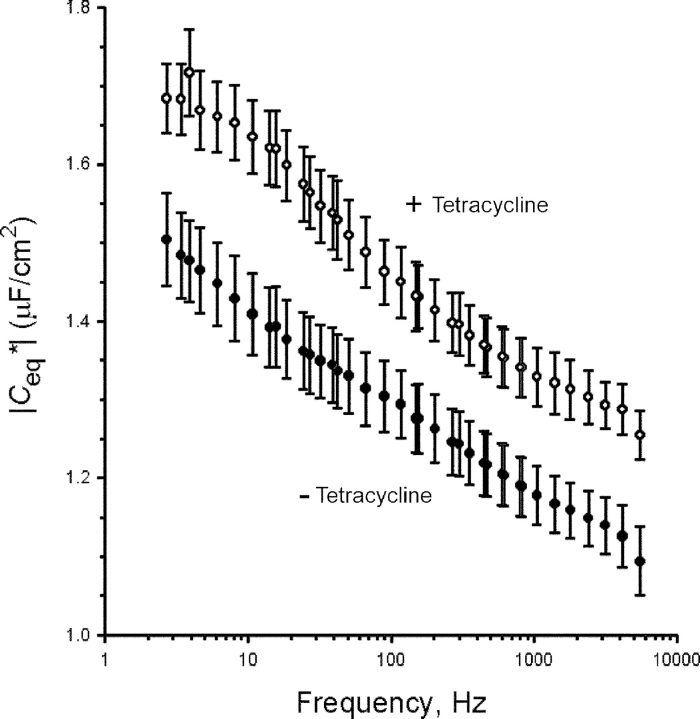
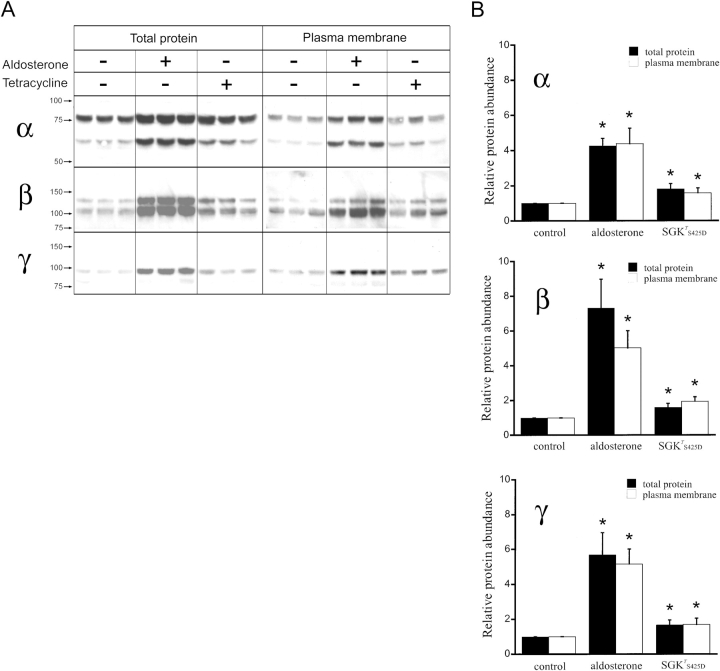
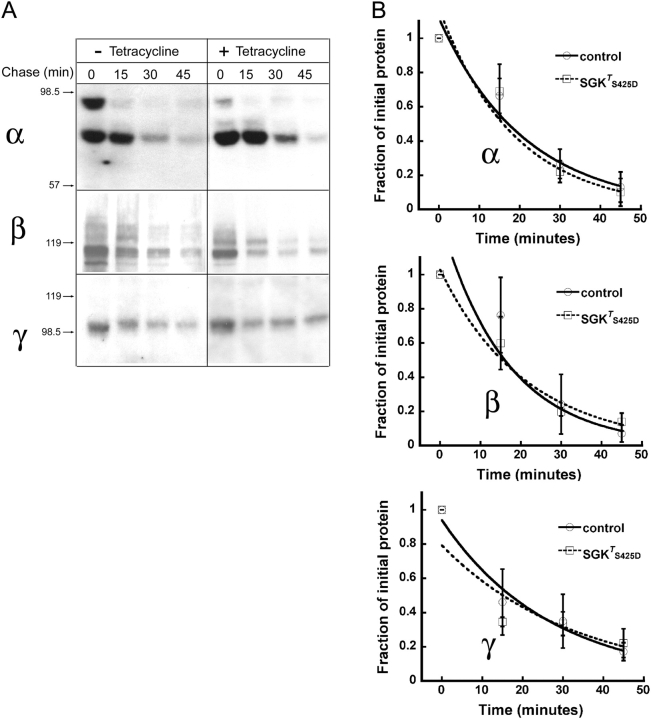
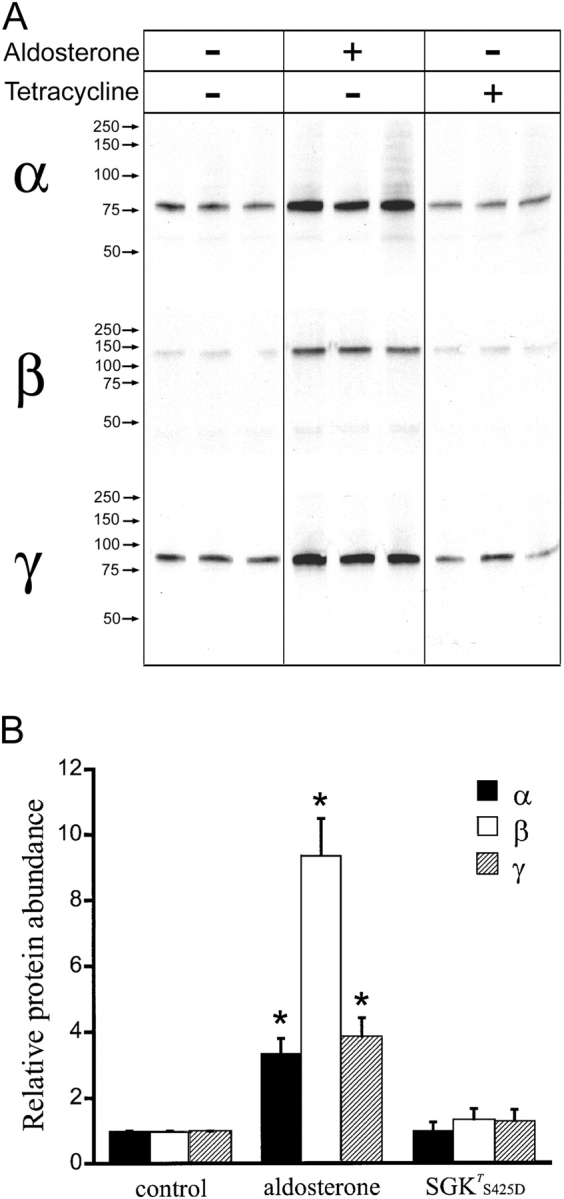
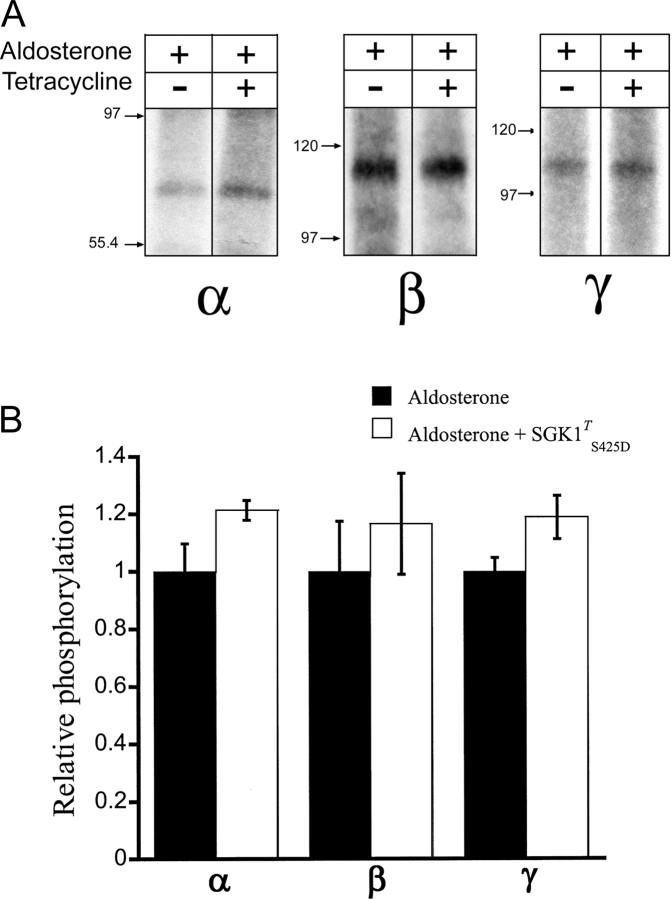
The serum and glucocorticoid induced kinase 1 (SGK1) participates in the regulation of sodium reabsorption in the distal segment of the renal tubule, where it may modify the function of the epithelial sodium channel (ENaC). The molecular mechanism underlying SGK1 regulation of ENaC in renal epithelial cells remains controversial. We have addressed this issue in an A6 renal epithelial cell line that expresses SGK1 under the control of a tetracycline-inducible system. Expression of a constitutively active mutant of SGK1 (SGK1T(S425D)) induced a sixfold increase in amiloride-sensitive short-circuit current (Isc). Using noise analysis we demonstrate that SGK1 effect on Isc is due to a fourfold increase in the number of functional ENaCs in the membrane and a 43% increase in channel open probability. Impedance analysis indicated that SGK1T(S425D) increased the absolute value of cell equivalent capacitance by an average of 13.7%. SGK1T(S425D) also produced a 1.6-1.9-fold increase in total and plasma membrane subunit abundance, without changing the half-life of channels in the membrane. We conclude that in contrast to aldosterone, where stimulation of transport can be explained simply by an increase in channel synthesis, SGK1 effects are more complex and involve at least three actions: (1) increase of ENaC open probability; (2) increase of subunit abundance within apical membranes and intracellular compartments; and (3) activation of one or more pools of preexistent channels within the apical membranes and/or intracellular compartments.


Figures

F<sc>igure</sc> 1.
Figure 1.
Representative strip-chart recordings of the short-circuit current, I sc, in (A) nontreated and (B) tetracycline-stimulated cells. The apical perfusion solution contained 10 μM CDPC except for the pulse periods when the blocker concentration was increased to 30 μM (arrows). The marked inhibition of current by 100 μM amiloride at the end of the experiments (arrowhead) confirmed that the I sc mostly reflects ENaC mediated Na+ currents. The amiloride sensitive currents are also subtracted from the short-circuit currents to determine macroscopic rates of sodium transport expressed as blocker-sensitive Na+ currents (I Na).
F<sc>igure</sc> 2.
Figure 2.
Stimulation of Na+ transport in A6 epithelia by SGKT S425D expression. (A) Rates of Na+ transport measured as macroscopic Na+ currents (I Na) are fivefold higher in tetracycline-treated cells (open circles) compared with nontreated cells (closed circles). (B) i Nas do not change significantly with expression of SGKT S425D (+tetracycline). (C) The increase in Na+ transport in tetracycline-treated cells is due to a comparable increase in ENaC open channel densities (N o). Values are means ± SE (n = 8 for nontreated cells, n = 9 for tetracycline-treated cells).
F<sc>igure</sc> 3.
Figure 3.
Typical current noise PDS in control and SGKT S42 5 D expressing A6 cells. Current noise PDS at 10 μM (open circles) and 30 μM CDPC (solid circles) in (A) control and (B) tetracycline-treated cells. Data were fit by nonlinear regression to three components, including a Lorentzian {S o/[1 + (f/f c)2]}, noise at low frequencies (S 1/fα), and noise at higher frequencies (S 2fβ), originating at the input stage of the voltage amplifier.
F<sc>igure</sc> 4.
Figure 4.
SGKT S425D expression increases the number of active ENaCs and channel P o in A6 epithelia. (A) Expression of SGKT S425D (open circles, +tetracycline) increases P o by 43% above control cells (closed circles, −tetracycline). (B) N T, calculated as the quotient N o/P o, increased by fourfold in cells expressing SGKT S425D (open circles, +tetracycline) compared with control cells (closed circles, −tetracycline). Values are means ± SE (n = 8 for nontreated cells, n = 9 for tetracycline-treated cells).
F<sc>igure</sc> 5.
Figure 5.
Expression of SGKT S425D increases the absolute value of the |C eq* | in A6 epithelia. Summary of the |C eq*| at frequencies between 2.5 Hz and 5.5 kHz. Values are means ± SE for control (closed circles, n = 8) and tetracycline-treated (open circles, n = 7) A6 monolayers. For clarity, only every third point is shown. Induction of SGKT S425D expression caused a significant increase of cell capacitance at every frequency point.
F<sc>igure</sc> 6.
Figure 6.
Aldosterone and SGKT S425D effects on the relative abundance of xENaC subunits in A6 cells. (A) A6 cells grown on filters were treated overnight with 100 nM aldosterone or 1 μg/ml of tetracycline. Each condition was performed in triplicate. Apical plasma membrane proteins were biotinylated, recovered with streptavidin–agarose beads and analyzed by Western blot with antibodies against xENaC subunits (plasma membrane). Aliquots of cells lysates were run in parallel (total protein). Representative Western blots are shown for α, β, and γ ENaC subunits. Arrows indicate the migration of molecular mass standards. Molecular mass values are given in kD. (B) Quantification of relative changes in α, β, and γ ENaC subunit protein abundance. Bars represent mean ± SE of the values obtained in six to nine independent experiments, each of them performed in triplicate. Solid bars correspond to total protein and open bars to plasma membrane protein. Asterisks indicate statistically significant changes when compared with control conditions (P < 0.05).
F<sc>igure</sc> 7.
Figure 7.
Quantification of total and plasma membrane ENaC in A6 cells. We used cell surface biotinylation to obtain an estimate of the number of ENaCs endogenously expressed in the plasma membrane of A6 cells. (A) Coomassie blue staining of a SDS-PAGE with the product of MBP–αENaC fusion protein purification. Molecular mass (kD) of each of the standards is indicated on the left. (B) A serial dilution of the MBP–αENaC fusion protein was detected by Western blot with a polyclonal antibody against α subunit. Signal intensities were quantified with a densitometer and plotted against the amount of fusion protein in fmol. The signal was linear between 5 and 20 fmol. (C) Samples from total protein (T) and biotinylated plasma membrane proteins (PM) were loaded in the same gel used for the serial dilution of fusion protein.
F<sc>igure</sc> 8.
Figure 8.
xENaC subunits half-life in the plasma membrane. A6 cells were grown on filters, serum depleted, and treated overnight with 1 μg/ml of tetracycline. Apical membrane proteins were biotinylated at 4°C and then chased in serum-free medium for the indicated period of time (min). (A) Representative Western blots of biotinylated proteins recovered from the lysates of nontreated and tetracycline-treated cells and probed with antibodies against α, β, or γ xENaC subunits. The arrows on the left indicate migration of molecular mass markers (kD). (B) Time course of the decay in surface xENaC subunits. Data points are the mean ± SE of four to five independent experiments normalized to the values at time 0 fitted to a single exponential. There is no statistically significant difference between any of the data points in the two groups.
F<sc>igure</sc> 9.
Figure 9.
Aldosterone and SGKT S425D effects on xENaC subunits rate of synthesis. (A) A6 cells grown on filters and serum depleted were treated overnight with 100 nM aldosterone or 1 μg/ml of tetracycline as indicated. Cells were metabolically labeled with [35S]methionine and [35S]cysteine for 15 min and lysed immediately afterwards. xENaC α, β, and γ subunits were recovered from the lysates by immunoprecipitation with specific polyclonal antibodies. The products of each immunoprecipitation were separated in SDS-PAGE and detected by autoradiography. A representative experiment performed in triplicate for each condition is shown. Arrows indicate the migration of molecular mass markers (kD). (B) Quantification of relative changes in α, β, and γ ENaC subunit rate of synthesis. Bars represent the mean ± SE of the values obtained in five independent experiments normalized to control conditions. Solid bars correspond to values for α subunit, open bars correspond to values for β subunit, and hatched bars correspond to values for γ subunit. Asterisks represent statistically significant changes when compared with control conditions. *, P < 0.01 compared with control.
F<sc>igure</sc> 10.
Figure 10.
SGKT S425D effects on xENaC subunits phosphorylation. (A) A6 cells grown on filters were treated overnight with 100 nM aldosterone or 100 nM aldosterone and 1 μg/ml of tetracycline. Each condition was performed in triplicate. Cells were metabolically labeled with [32P]orthophosphate for 4 h in the presence of aldosterone or a combination of aldosterone and tetracycline and then lysed in the presence of phosphatase inhibitors. xENaC α, β, and γ subunits were recovered from the lysates by immunoprecipitation with specific polyclonal antibodies. The products of each immunoprecipitation were separated in SDS-PAGE and detected by autoradiography. Representative examples of α, β, and γ immunoprecipitation products for each condition are shown. Arrows indicate the migration of molecular mass markers (kD). (B) Quantification of relative changes in α, β, and γ ENaC subunit phosphorylation. Bars represent the mean ± SE of the values obtained from three samples normalized to those obtained from cells treated with aldosterone (solid bars). Open bars correspond to values obtained from cells treated with aldosterone and tetracycline.

Similar articles

Cited by

References

    1. Abramcheck, F.J., W. Van Driessche, and S.I. Helman. 1985. Autoregulation of apical membrane Na+ permeability of tight epithelia. Noise analysis with amiloride and CGS 4270. J. Gen. Physiol. 85:555–582. - PMC - PubMed
    1. Alvarez de la Rosa, D., and C.M. Canessa. 2003. Role of SGK in hormonal regulation of epithelial sodium channel in A6 cells. Am. J. Physiol. Cell Physiol. 284:C404–C414. - PubMed
    1. Alvarez de la Rosa, D., P. Zhang, A. Naray-Fejes-Toth, G. Fejes-Toth, and C.M. Canessa. 1999. The serum and glucocorticoid kinase sgk increases the abundance of epithelial sodium channels in the plasma membrane of Xenopus oocytes. J. Biol. Chem. 274:37834–37839. - PubMed
    1. Alvarez de la Rosa, D., H. Li, and C.M. Canessa. 2002. Effects of aldosterone on biosynthesis, traffic, and functional expression of epithelial sodium channels in A6 cells. J. Gen. Physiol. 119:427–442. - PMC - PubMed
    1. Alvarez de la Rosa, D., T. Coric, N. Todorovic, D. Shao, T. Wang, and C.M. Canessa. 2003. Distribution and regulation of expression of serum- and glucocorticoid-induced kinase-1 in the rat kidney. J. Physiol. 551:455–466. - PMC - PubMed

Publication types

MeSH terms