. 2004 Oct 5;101(40):14431-6.
doi: 10.1073/pnas.0405847101. Epub 2004 Sep 27.

Systematic investigation of protein phase behavior with a microfluidic formulator

Affiliations

Systematic investigation of protein phase behavior with a microfluidic formulator

Carl L Hansen et al. Proc Natl Acad Sci U S A. .

Abstract

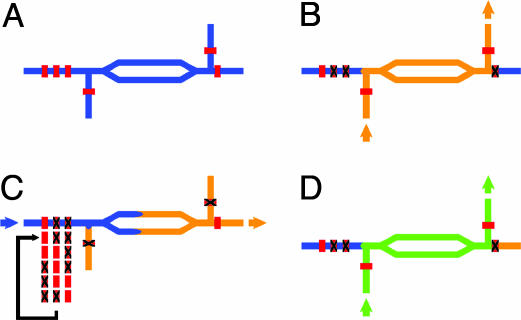
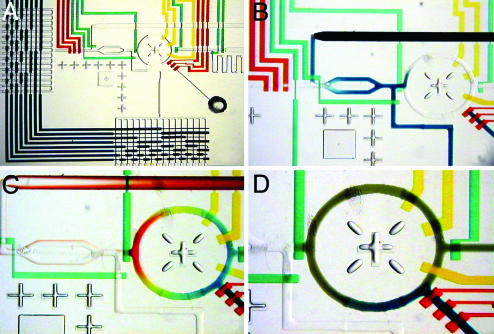
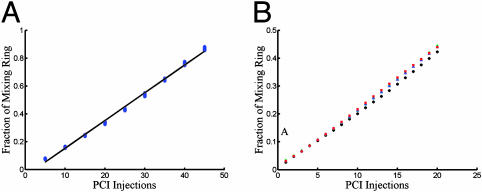
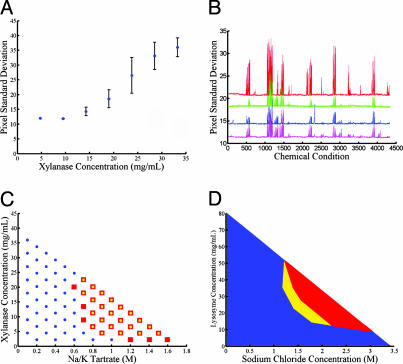
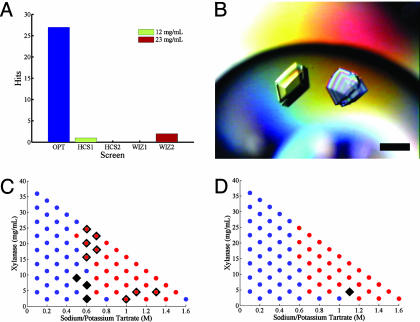
We demonstrated a microfluidic device for rapidly generating complex mixtures of 32 stock reagents in a 5-nl reactor. This "formulation chip" is fully automated and allows thousands of experiments to be performed in a single day with minimal reagent consumption. It was applied to systematically study the phase behavior of the protein xylanase over a large and complex chemical space. For each chemical formulation that demonstrated a pronounced effect on solubility, the protein phase behavior was completely mapped in the chip, generating a set of empirical phase diagrams. This ab initio phase information was used to devise a rational crystallization screen that resulted in 72-fold improvement in successful crystallization hits compared with conventional sparse matrix screens. This formulations tool allows a physics-based approach to protein crystallization that may prove useful in structural genomics efforts.


Figures

Fig. 1.
Fig. 1.
PCI for robust and programmable high-precision dispensing on chip. These schematic diagrams illustrate the PCI method. (A) A four-port PCI junction. The split-channel architecture creates a large-volume injector region, thereby allowing for an increased number of injections before recharging. Channels/fluids are indicated in blue; valves are red. (B) Charging of the injector region of the PCI junction. Junction valves are actuated to direct the flow vertically through the junction, filling the injector region with orange fluid. (C) Precise positive displacement metering by actuation of peristaltic pump. A peristaltic pump is created by three consecutive valves; the pumping sequence is shown. Pumping the blue fluid injects a metered volume of the orange fluid into the next section of the chip (not shown). (D) The PCI junction is sequentially charged with different solutions to create complex multicomponent mixtures; in this case, the second injection is with a green fluid.
Fig. 2.
Fig. 2.
Combinatorial mixing using a microfluidic formulator. These optical micrographs show the manipulation of food dyes with the formulator chip. In all images, the diameter of the mixing ring is 1.5 mm. (A) Integration of multiplexer (dark blue), peristaltic pumps (red), rotary mixer (yellow), and PCI junction (center, green) components for on-chip combinatorial formulation. (B) Injection of ≈250 pl (four injection cycles) of blue dye into rotary mixer. (C) Color gradient formed by consecutive injections into mixing ring (eight injections blue, eight injections green, eight injections yellow, and eight injections red). (D) Pumping around ring for 3 sec results in complete mixing of dye. Blue dye is then added to mixture through sample injection inlet (bottom right).
Fig. 3.
Fig. 3.
Precise and robust microfluidic metering. Absorption spectroscopy is used to measure the replaced fraction of fluid in the ring reactor from PCI injections. The total ring volume is nominally 5 nl. (A) Precision and reproducibility of PCI injections. Each of the nine clusters represents 100 identical injection sequences; the standard deviation of the clusters corresponds to an injection error of ≈0.6 pl. (B) Absorption measurements of four sets of 20 injection and mixing sequences show the metering to be robust to the viscosity of the injected fluid. Fluids contain varying amounts of glycerol and have viscosities ranging from 1 to 400 cP.
Fig. 4.
Fig. 4.
Automated exploration of protein solubility using the microfluidic formulator. (A) Precipitation measurements at varying concentrations of xylanase in 0.6 M potassium phosphate with 0.1 M Tris·HCl, pH 6.5. The standard deviation of pixel intensities provides a quantitative metric of protein precipitation in the ring reactor. Below the precipitation limit, the standard deviation shows constant background level with low variation. Above 12 mg/ml, the solution is in the precipitation regime, and the pixel standard deviation exhibits an approximately linear dependence on protein concentration. All points represent the mean of five identical experiments, with error bars indicating standard deviation of measurements. (B) Solubility fingerprints of xylanase over ≈4,300 chemical conditions. Each data series represents a separate fingerprinting experiment using the same basis of chemical conditions. The top solubility fingerprint (red) is generated by using a sample having elevated protein concentration (90 mg/ml) and exhibits both higher signal-to-noise ratio and additional peaks not present in the other data series (70 mg/ml). The two center solubility fingerprints were generated sequentially on a single device (first green, then blue) with the same loaded sample, demonstrating the stability of the protein over the time of the experiment (≈40 h). The bottom solubility fingerprint (pink) was generated on a separate device by using the same protein sample as the blue fingerprint, showing reproducibility across devices. (C) Comparison of xylanase phase mapping done on chip and in microbatch experiments. Conditions that gave rise to precipitation in microbatch format and in chip are represented by red squares and overlaid yellow circles, respectively. Conditions that did not produce precipitation in either format are shown as blue circles. (D) Reversibility of precipitation and solubility hysteresis for lysozyme observed by outward and return titrations from the origin. The red region shows the area of phase space in which precipitation was observed in both outward and return titrations. The yellow region is the area of hysteresis in which the protein was soluble for the outward titrations but precipitated in the return titrations. The blue region is the area in which the protein was soluble for both the outward and return titrations.
Fig. 5.
Fig. 5.
Comparison of xylanase microbatch crystallization experiments using an optimal crystallization screen based on solubility phase spaces to commercially available sparse matrix screens. (A) Histogram showing number of successful crystallization conditions identified with sparse matrix screens (each at protein concentrations of 12 and 23 mg/ml) and optimal screen. (B) Polarized micrograph of large single crystals grown directly from optimal screen (16% polyethylene glycol 8000/65 mM sodium chloride/65 mM Tris·HCl, pH 8.2/42 mg/ml xylanase). (Bar, 200 μm.) (C and D) Comparison of phase-space behavior and crystallization variability of the original protein sample (C) and the second protein sample (D) in microbatch format. Conditions that gave rise to crystallization are shown as black triangles. Conditions that gave rise to immediate precipitation are represented as overlaid red circles. Blue circles represent conditions in which the protein was soluble and did not produce crystals.

References

    1. Kendrew, J. C., Bodo, G., Dintzis, H. M., Parrish, R. G., Wyckoff, H. & Phillips, D. C. (1958) Nature 181, 662-666. - PubMed
    1. Loll, P. J. (2003) J. Struct. Biol. 142, 144-153. - PubMed
    1. Chayen, N. E. & Saridakis, E. (2002) Acta Crystallogr. D 58, 921-927. - PubMed
    1. Luft, J. R. & DeTitta, G. (1997) Macromol. Crystallogr. A. 276, 110-131. - PubMed
    1. Rosenbaum, D. F. & Zukoski, C. F. (1996) J. Cryst. Growth 169, 752-758.

Publication types

LinkOut - more resources