. 2005 Feb 1;385(Pt 3):745-54.
doi: 10.1042/BJ20041015.

Electrochemical redox transformations of T1 and T2 copper sites in native Trametes hirsuta laccase at gold electrode

Affiliations

Electrochemical redox transformations of T1 and T2 copper sites in native Trametes hirsuta laccase at gold electrode

Sergey Shleev et al. Biochem J. .

Abstract

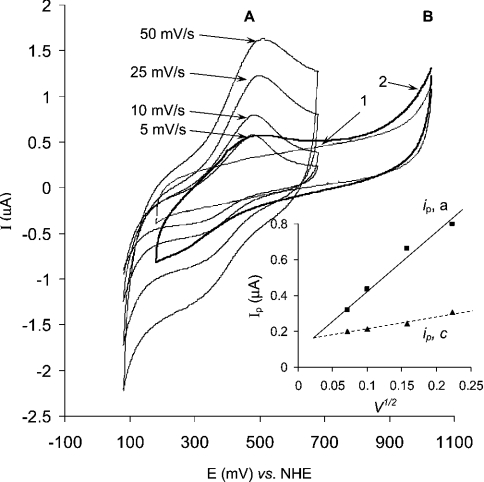
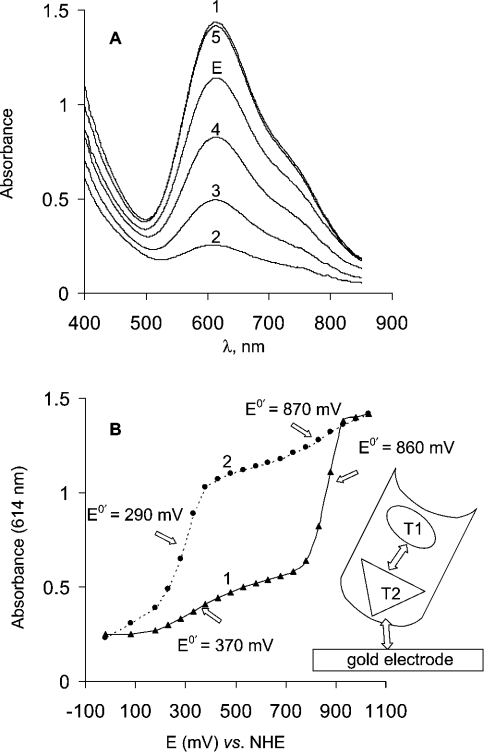
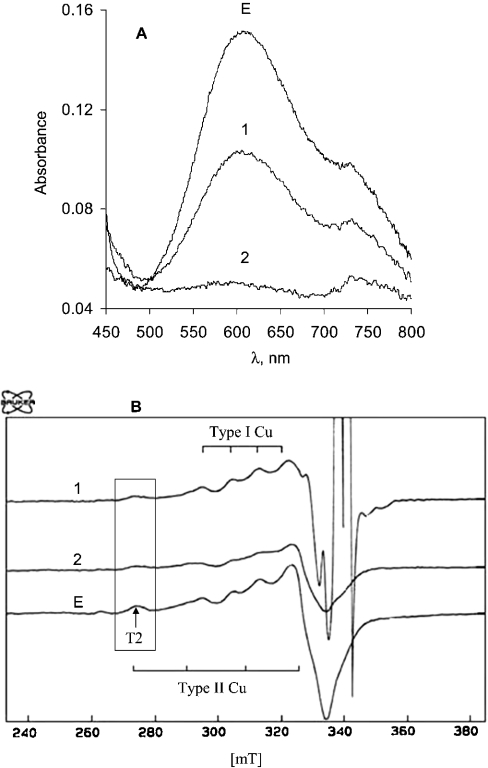
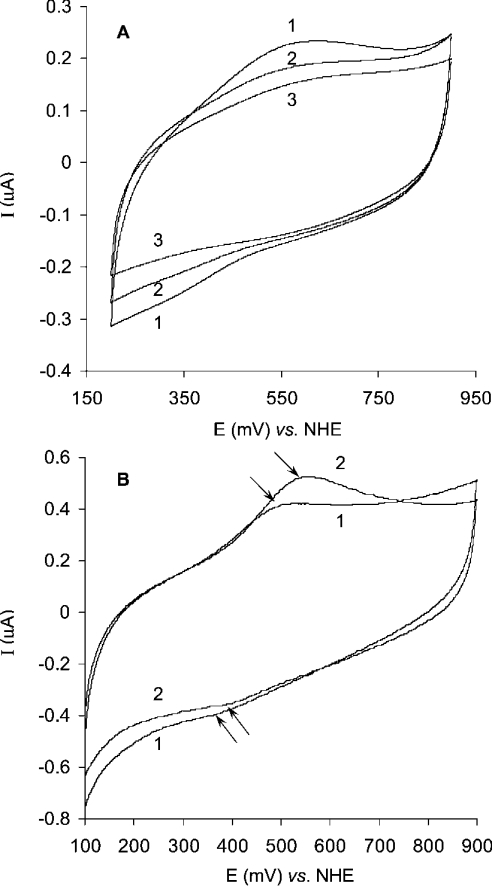
Mediatorless, electrochemically driven, redox transformations of T1 (type 1) and T2 copper sites in Trametes hirsuta laccase were studied by cyclic voltammetry and spectroelectrochemical redox titrations using bare gold electrode. DET (direct electron transfer) between the electrode and the enzyme was observed under anaerobic conditions. From analysis of experimental data it is concluded that the T2 copper site is in DET contact with gold. It was found that electron transfer between the gold surface and the T1 copper site progresses through the T2 copper site. From EPR measurements and electrochemical data it is proposed that the redox potential of the T2 site for high-potential 'blue' laccase is equal to about 400 mV versus NHE (normal hydrogen electrode) at pH 6.5. The hypothesis that the redox potentials of the T2 copper sites in low- and high-potential laccases/oxidases from totally different sources might be very similar, i.e. approx. 400 mV, is discussed.


Figures

Figure 1
Figure 1. SDS/PAGE of the preparation of T. hirsuta laccase
Lane A, the laccase preparation; lane Mr, molecular mass markers (shown in kDa on the left).
Figure 2
Figure 2. Redox titration of the T1 copper site in laccase from T. hirsuta using the redox mediator couple K4[Mo(CN)8]/K3[Mo(CN)8]
The experiments were performed in 0.1 M phosphate buffer pH 6.0. Inset, potentiometric titration curve.
Figure 3
Figure 3. Cyclic voltammograms of laccase in the capillary gold electrode
The experiments were performed in 0.1 M phosphate buffer, pH 6.5, and in (A) and (B) the solution contained 10 mg/ml of T. hirsuta laccase. (A) Cyclic voltammogramms recorded at different scan rates; start potential, 80 mV versus NHE. Inset, the dependence of anodic and cathodic peak current on the square root of the potential scan rate (V/s). (B) Cyclic voltammograms recorded at 10 mV/s in a broader potential window; start potential, 1030 mV versus NHE. Curve 1, control measurement in the absence of the laccase; curve 2, with laccase.
Figure 4
Figure 4. Mediatorless spectroelectrochemical redox titration of T. hirsuta laccase by using a gold capillary cell
(A) Absorbance spectra recorded during redox titration of T. hirsuta laccase in the spectroelectrochemical gold capillary cell. The experiments were performed in 0.1 M phosphate buffer, pH 6.5. Curves E and 1–5 are absorbance spectra of initially injected enzyme and at applied potentials −20, 530, 830 and 1030 mV respectively. (B) Spectroelectrochemical titration curves reflecting the dependence of absorbance of the laccase solution at 614 nm versus the applied potential. Titration curves recorded by changing the applied potential (curve 1) from −20 to 1030 mV and (curve 2) from 1030 to −20 mV.
Figure 5
Figure 5. Absorption (A) and EPR (B) spectra of T. hirsuta laccase during the redox titration by different mediators
The experiments were performed in 0.1 M phosphate buffer, pH 6.5. Spectrum E characterizes the solution of laccase before addition of mediators. Spectrum 1 was recorded after mixing the enzyme with K3Mo(CN)8 and K4Mo(CN)8 (the redox potential after equilibrium, 770 mV versus NHE). Spectrum 2 was recorded after mixing the enzyme with K3Fe(CN)6 and K4Fe(CN)6 (the redox potential after equilibrium, 450 mV versus NHE).
Figure 6
Figure 6. Cyclic voltammograms of laccase on the planar gold electrode
The experiments were performed in 0.1 M phosphate buffer, pH 6.5. (A) Curve 1, native enzyme; curve 2, partly T2-depleted laccase; curve 3, apoenzyme. Laccase concentration, 4 mg/ml; scan rate, 10 mV/s; start potential, 900 mV versus NHE. (B) Curve 1, native enzyme; curve 2, after interaction with F ions (10 mM) for 10 min. Laccase concentration, 7 mg/ml; scan rate, 50 mV/s; start potential, 100 mV versus NHE.

References

    1. Gorton L., Lindgren A., Larsson T., Munteanu F. D., Ruzgas T., Gazaryan I. Direct electron transfer between heme-containing enzymes and electrodes as basis for third generation biosensors. Anal. Chim. Acta. 1999;400:91–108.
    1. Berezin I. V., Bogdanovskaya V. A., Varfolomeev S. D., Tarasevich M. R., Yaropolov A. I. Bioelectrocatalysis. Equilibrium oxygen potential in the presence of laccase. Dokl. Akad. Nauk SSSR. 1978;240:615–618.
    1. Kuznetsov B. A., Shumakovich G. P., Koroleva O. V., Yaropolov A. I. On applicability of laccase as label in the mediated and mediatorless electroimmunoassay: effect of distance on the direct electron transfer between laccase and electrode. Biosens. Bioelectron. 2001;16:73–84. - PubMed
    1. Solomon E. I., Sundaram U. M., Machonkin T. E. Multicopper oxidases and oxygenases. Chem. Rev. 1996;96:2563–2605. - PubMed
    1. Barton S. C., Kim H.-H., Binyamin G., Zhang Y., Heller A. The ‘wired’ laccase cathode: high current density electroreduction of O2 to water at +0.7 V (NHE) at pH 5. J. Am. Chem. Soc. 2001;123:5802–5803. - PubMed

Publication types